

What's behind National Grid's latest stock pullback?

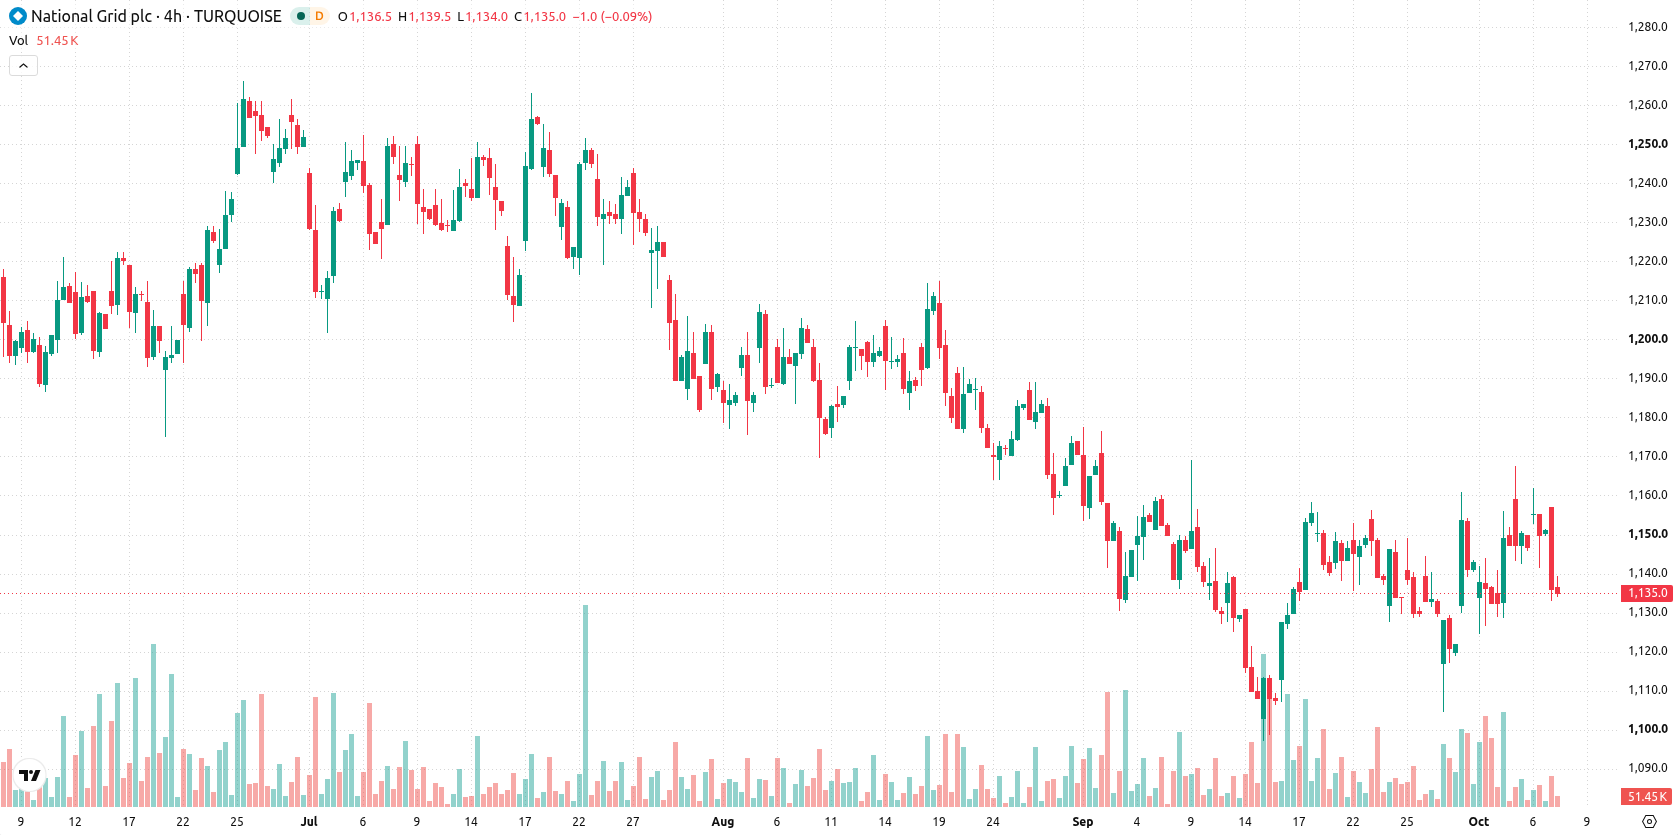
National Grid plc (NG) fell 1.52% after sellers kept pressure on the shares, even as the company raised its fiscal 2027 earnings-per-share guidance and reported stronger first-half results. The move is reinforced by the stock remaining below its 20-, 50-, and 200-day moving averages, which confirms persistent downward pressure.
 1284.50
Highlights
- National Grid raised its fiscal year 2027 earnings-per-share growth target to above the previous 13% to 15% range after stronger first-half results in Ventures and Other.
- First-half performance included GBP 130 million from one-off gains and improved interconnector trading, driving a 3.8% dividend per share increase to 48.49 pence.
- Shares of National Grid trade below key moving averages with mixed momentum signals and an expected five-day range of GBX1,112 to GBX1,155.
Profit beat and dividend lift countered by continued negative flows
National Grid raised its fiscal year 2027 earnings-per-share guidance to slightly above the previous 13% to 15% range, following a stronger than expected first-half in its Ventures and Other division. The increase was linked to one-off fair-value gains from two capital-market transactions in the NG Partners investment portfolio and improved interconnector trading. An additional GBP 130 million was reported in first-half performance, and the dividend per share was increased by 3.8% to 48.49 pence. These developments occurred, though price action has remained under broader selling pressure.
Mixed momentum as key moving averages cap recovery effort
National Grid is trading below the 20-day (GBX1,135), 50-day (GBX1,162), and 200-day (GBX1,234) moving averages, suggesting continued pressure from sellers in the short, medium, and long term. The 20-day moving average at GBX1,135 now acts as a near-term ceiling, with support at the recent week low of GBX1,125, while the Ichimoku Kijun line at GBX1,137 signals additional resistance just overhead. Momentum is mixed, as the Moving Average Convergence Divergence (MACD) indicates strong selling, yet the Relative Strength Index (RSI) and Commodity Channel Index (CCI) both post buy signals, and the Average Directional Index (ADX) suggests a weak trend. The Stochastic RSI is overbought at 100, while Bull/Bear Power (BBP) reads strongly positive at 21.34, pointing to buyers dominating intraday flows with a note of overbought conditions. Volatility stands at 1.85%.
Earlier, analysts noted that National Grid was expected to trade sideways within a volatility corridor, with limited prospects for a decisive breakout in either direction. The current technical and fundamental setup reinforces this outlook, with traders advised to monitor GBX1,125 as a critical support level that could signal further downside if breached.











-
 Afghanistan
-
 Albania
-
 Algeria
-
 Angola
-
 Argentina
-
 Armenia
-
 Australia
-
 Austria
-
 Azerbaijan
-
 Bahamas
-
 Bahrain
-
 Bangladesh
-
 Belarus
-
 Belgium
-
 Bolivia
-
 Botswana
-
 Brazil
-
 Brunei
-
 Bulgaria
-
 Cambodia
-
 Cameroon
-
 Canada
-
 Chile
-
 China
-
 Colombia
-
 Congo
-
 Costa Rica
-
 Cote d'Ivoire
-
 Croatia
-
 Cuba
-
 Cyprus
-
 Czechia
-
 DR Congo
-
 Denmark
-
 Dominican Republic
-
 Ecuador
-
 Egypt
-
 El Salvador
-
 Estonia
-
 Eswatini
-
 Ethiopia
-
 Finland
-
 France
-
 Georgia
-
 Germany
-
 Ghana
-
 Greece
-
 Haiti
-
 Hong Kong
-
 Hungary
-
 India
-
 Indonesia
-
 Iran, Islamic republic
-
 Iraq
-
 Ireland
-
 Israel
-
 Italy
-
 Jamaica
-
 Japan
-
 Jordan
-
 Kazakhstan
-
 Kenya
-
 Korea
-
 Kuwait
-
 Kyrgyzstan
-
 Laos
-
 Latvia
-
 Lebanon
-
 Lesotho
-
 Libya
-
 Lithuania
-
 Luxembourg
-
 Madagascar
-
 Malaysia
-
 Malta
-
 Mauritius
-
 Mexico
-
 Moldova
-
 Mongolia
-
 Montenegro
-
 Morocco
-
 Mozambique
-
 Myanmar
-
 Namibia
-
 Nepal
-
 Netherlands
-
 New Zealand
-
 Nigeria
-
 North Macedonia
-
 Norway
-
 Oman
-
 Pakistan
-
 Palestine
-
 Panama
-
 Papua New Guinea
-
 Paraguay
-
 Peru
-
 Philippines
-
 Poland
-
 Portugal
-
 Puerto Rico
-
 Qatar
-
 Reunion
-
 Romania
-
 Rwanda
-
 Saudi Arabia
-
 Serbia
-
 Singapore
-
 Slovakia
-
 Slovenia
-
 Somalia
-
 South Africa
-
 Spain
-
 Sri Lanka
-
 Sweden
-
 Switzerland
-
 Syria
-
 Taiwan
-
 Tajikistan
-
 Tanzania
-
 Thailand
-
 Trinidad and Tobago
-
 Tunisia
-
 Turkey
-
 UAE
-
 Uganda
-
 Ukraine
-
 United Kingdom
-
United States
-
 Uruguay
-
 Uzbekistan
-
 Venezuela
-
 Vietnam
-
 Yemen
-
 Zambia
-
 Zimbabwe
- Forex
- Crypto












