

Costco stock consolidates as buyers and sellers battle near highs: weekly analysis

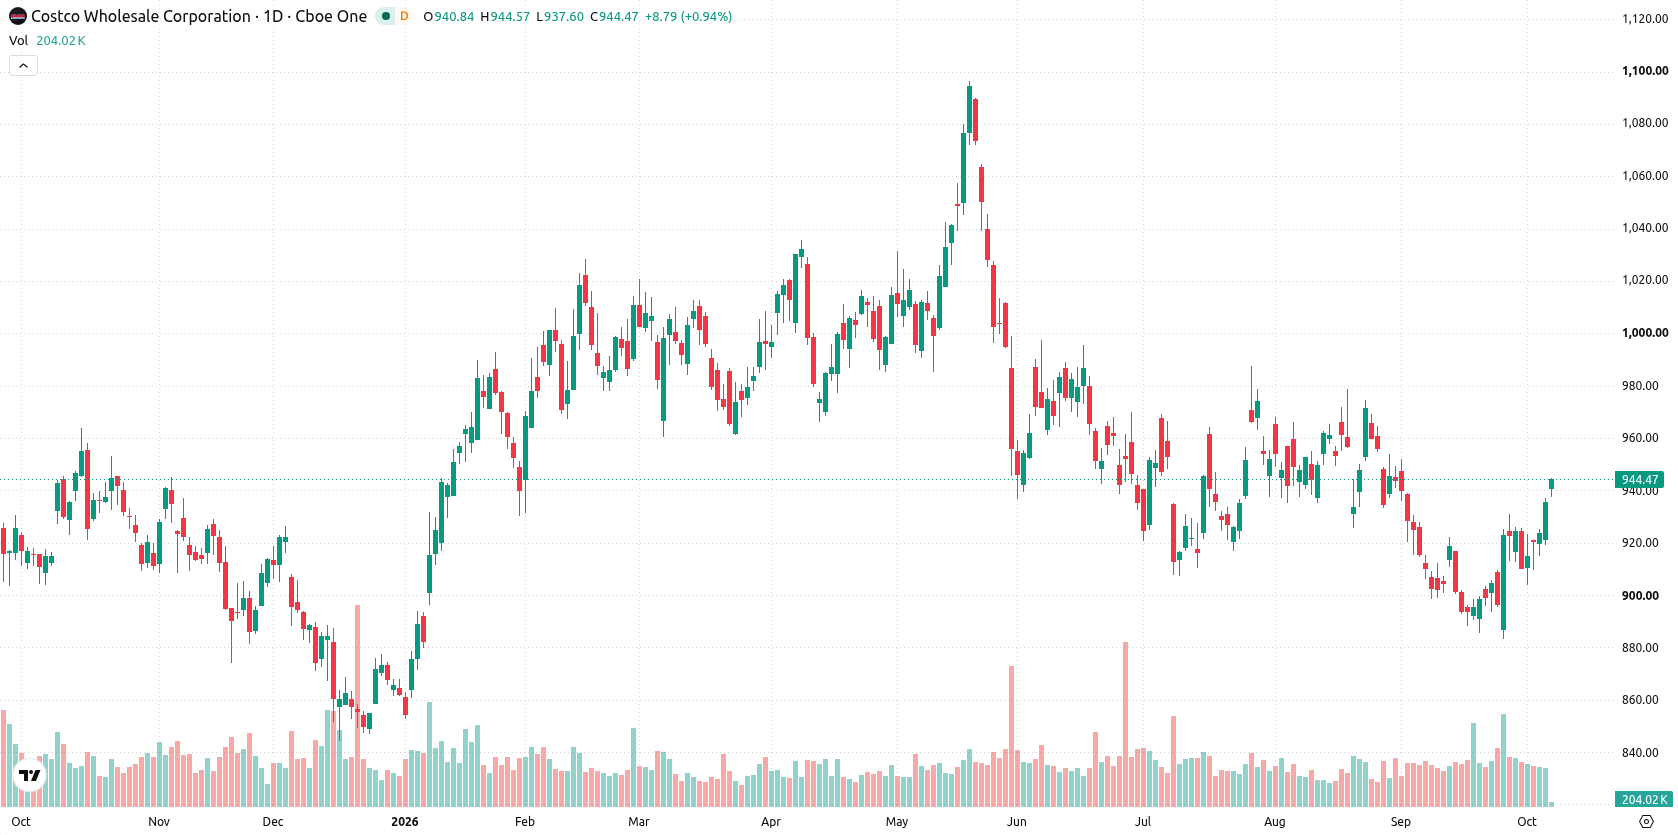
Shares of Costco Wholesale Corporation (COST) are trading near $942, following a recovery that saw the stock rise about 2.3% over the week. Despite the gains, the technical setup is showing signs of exhaustion as mixed momentum signals keep buyers cautious. With conflicting signals in play, the week ahead may hinge on whether this stretch can sustain or gives way to a pause.
 1021.17
Highlights
- Shares of Costco climbed 3.57% over the past week to $942.09, trading above short-term moving averages but below the 200-day average.
- Technical indicators show mixed signals, with shares at the top of the weekly range and momentum turning overbought, while trend strength remains flat.
- For the coming week, shares are expected to consolidate between $916.81 and $956.53, with immediate support at $937.04 and resistance at $962.08.
Omnichannel sales and membership gains sustain upbeat sentiment this week
Costco reported its fiscal 2026 results with total revenue of $303.15 billion and diluted earnings per share of $20.76, according to TradingView. Membership growth and strong omnichannel sales were key contributors to performance, and the U.S. and Canada renewal rate reached 92.3%, as highlighted by Simply Wall St. The fourth quarter saw net income of $2.998 billion on $93.87 billion in sales.
Resistance and overbought signals cap upside as momentum stalls near range top
On the daily chart, the stock is at the very top of its weekly range after a 3.57% stretch upward, yet trend strength is flat, reflecting a contained move within a narrow range. Momentum signals are mixed, with CCI at 154.94 and Stochastic RSI at 100, both in the overbought zone, while the MACD stays neutral. Immediate support is seen at $937.04, with significant resistance at $962.08 from the MA-200. This setup suggests a pause or consolidation phase is likely as buyers and sellers battle around current levels.
Neutral bias persists in coming week with range-bound action expected
For the next five trading days, the expected range is $916.81 to $956.53, with an equal 50% probability of an increase or decrease. The base case is for shares to consolidate inside this band, holding near $942.09 unless momentum breaks. A bullish scenario would require a close above $962.08, targeting further gains. Any reversal below $937.04 support could open a retreat toward the lower bound of the range at $916.81.
Previously it was reported that limited-time product launches and innovative brand engagement contributed to driving sales growth for leading retailers. Costco's current technical setup now brings consolidation risks to the forefront, with traders advised to monitor the $937.04 support and $962.08 resistance as key pivots for near-term direction.











-
 Afghanistan
-
 Albania
-
 Algeria
-
 Angola
-
 Argentina
-
 Armenia
-
 Australia
-
 Austria
-
 Azerbaijan
-
 Bahamas
-
 Bahrain
-
 Bangladesh
-
 Belarus
-
 Belgium
-
 Bolivia
-
 Botswana
-
 Brazil
-
 Brunei
-
 Bulgaria
-
 Cambodia
-
 Cameroon
-
 Canada
-
 Chile
-
 China
-
 Colombia
-
 Congo
-
 Costa Rica
-
 Cote d'Ivoire
-
 Croatia
-
 Cuba
-
 Cyprus
-
 Czechia
-
 DR Congo
-
 Denmark
-
 Dominican Republic
-
 Ecuador
-
 Egypt
-
 El Salvador
-
 Estonia
-
 Eswatini
-
 Ethiopia
-
 Finland
-
 France
-
 Georgia
-
 Germany
-
 Ghana
-
 Greece
-
 Haiti
-
 Hong Kong
-
 Hungary
-
 India
-
 Indonesia
-
 Iran, Islamic republic
-
 Iraq
-
 Ireland
-
 Israel
-
 Italy
-
 Jamaica
-
 Japan
-
 Jordan
-
 Kazakhstan
-
 Kenya
-
 Korea
-
 Kuwait
-
 Kyrgyzstan
-
 Laos
-
 Latvia
-
 Lebanon
-
 Lesotho
-
 Libya
-
 Lithuania
-
 Luxembourg
-
 Madagascar
-
 Malaysia
-
 Malta
-
 Mauritius
-
 Mexico
-
 Moldova
-
 Mongolia
-
 Montenegro
-
 Morocco
-
 Mozambique
-
 Myanmar
-
 Namibia
-
 Nepal
-
 Netherlands
-
 New Zealand
-
 Nigeria
-
 North Macedonia
-
 Norway
-
 Oman
-
 Pakistan
-
 Palestine
-
 Panama
-
 Papua New Guinea
-
 Paraguay
-
 Peru
-
 Philippines
-
 Poland
-
 Portugal
-
 Puerto Rico
-
 Qatar
-
 Reunion
-
 Romania
-
 Rwanda
-
 Saudi Arabia
-
 Serbia
-
 Singapore
-
 Slovakia
-
 Slovenia
-
 Somalia
-
 South Africa
-
 Spain
-
 Sri Lanka
-
 Sweden
-
 Switzerland
-
 Syria
-
 Taiwan
-
 Tajikistan
-
 Tanzania
-
 Thailand
-
 Trinidad and Tobago
-
 Tunisia
-
 Turkey
-
 UAE
-
 Uganda
-
 Ukraine
-
 United Kingdom
-
United States
-
 Uruguay
-
 Uzbekistan
-
 Venezuela
-
 Vietnam
-
 Yemen
-
 Zambia
-
 Zimbabwe
- Forex
- Crypto












