

Manulife Financial stock outlook: Support pressure triggers weak momentum

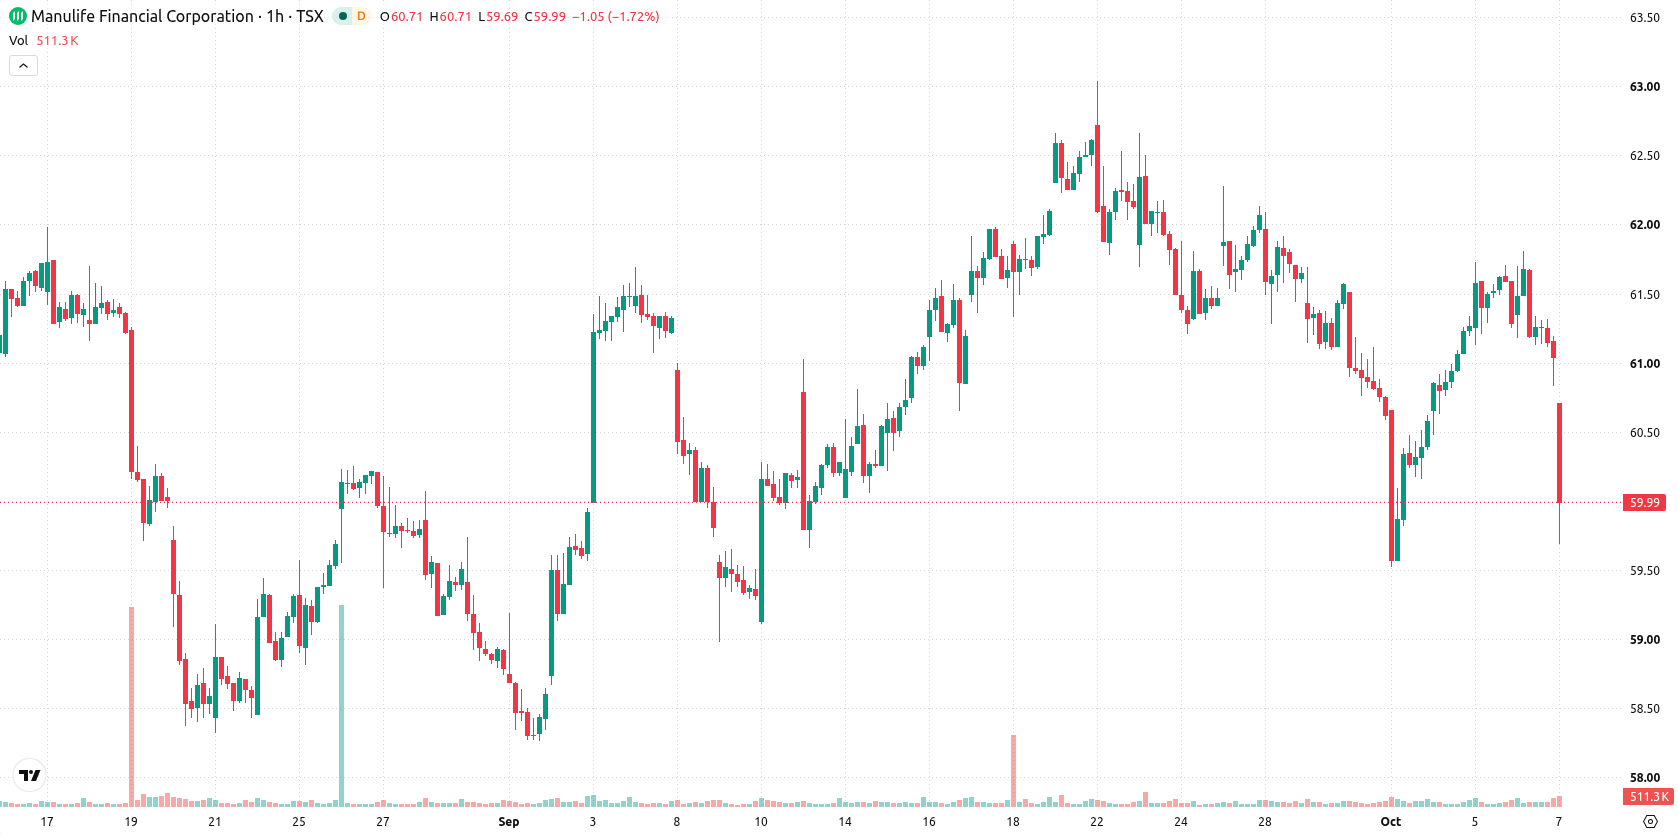
Manulife Financial (MFC) stock is trading at C$59.9, down 1.82% on the day. The price sits below its key short- and medium-term moving averages but remains above the longer-term daily average.
 62.65
63.65
Highlights
- Manulife Financial reported earnings per share and operational results above consensus across insurance, wealth, and asset management segments, confirming ongoing profitability.
- Improved cash generation increased financial flexibility, and a new partnership with The Hinton Lectures targets greater public engagement on AI safety.
- Shares of Manulife closed at C$59.9, trading below key moving averages with a 79% probability of further short-term downside toward C$58.88 support.
Profit beat and operational gains met with selling pressure
Manulife Financial reported quarterly results that exceeded consensus expectations, with strong earnings per share and robust operational performance across its insurance, wealth, and asset management segments. This outcome highlights ongoing profitability and suggests effective execution, though market reaction has not followed the underlying trend. The company also noted improved cash generation and greater financial flexibility to support future operations, while its new two-year presenting partnership with The Hinton Lectures™, according to Acrofan, aims to elevate public engagement on AI safety. These positive developments arrive even as price action has remained under broader selling pressure.
Oversold momentum intensifies as key resistance holds
On the technical front, MFC is trading below its MA-20 at C$61.27 and MA-50 at C$61.11 on the hourly chart, while remaining above the daily MA-200 situated at C$54.53. The Ichimoku Kijun level at C$60.99 serves as immediate resistance. MACD and ADX are both showing neutral conditions, while the RSI is at 33.73, indicating a sell bias. Additional intraday indicators, including Stoch RSI, CCI, and Bull/Bear Power, all point to oversold readings, emphasizing dominant seller momentum in the short term.
Rangebound outlook dominates as downside risk prevails
Looking ahead to the next several sessions, the price is anticipated to fluctuate within a range of C$58.88 to C$60.92, reflecting typical volatility around current levels. The probability framework assigns a 21% chance to an upside move versus a 79% likelihood of further downside. The baseline scenario expects a sideways evolution within this corridor, while a bullish breakout would require clearing the C$60.99 resistance; a move below the C$58.88 support would reinforce further weakness.
Earlier, analysts noted that Manulife Financial shares were expected to consolidate within a defined range as technical signals remained neutral and capital return actions were absorbed by the market. The current analysis signals a shift toward increased downside risk, with C$58.88 serving as a key support level for investors to monitor in the sessions ahead.






Latest Manulife Financial News




-
 Afghanistan
-
 Albania
-
 Algeria
-
 Angola
-
 Argentina
-
 Armenia
-
 Australia
-
 Austria
-
 Azerbaijan
-
 Bahamas
-
 Bahrain
-
 Bangladesh
-
 Belarus
-
 Belgium
-
 Bolivia
-
 Botswana
-
 Brazil
-
 Brunei
-
 Bulgaria
-
 Cambodia
-
 Cameroon
-
 Canada
-
 Chile
-
 China
-
 Colombia
-
 Congo
-
 Costa Rica
-
 Cote d'Ivoire
-
 Croatia
-
 Cuba
-
 Cyprus
-
 Czechia
-
 DR Congo
-
 Denmark
-
 Dominican Republic
-
 Ecuador
-
 Egypt
-
 El Salvador
-
 Estonia
-
 Eswatini
-
 Ethiopia
-
 Finland
-
 France
-
 Georgia
-
 Germany
-
 Ghana
-
 Greece
-
 Haiti
-
 Hong Kong
-
 Hungary
-
 India
-
 Indonesia
-
 Iran, Islamic republic
-
 Iraq
-
 Ireland
-
 Israel
-
 Italy
-
 Jamaica
-
 Japan
-
 Jordan
-
 Kazakhstan
-
 Kenya
-
 Korea
-
 Kuwait
-
 Kyrgyzstan
-
 Laos
-
 Latvia
-
 Lebanon
-
 Lesotho
-
 Libya
-
 Lithuania
-
 Luxembourg
-
 Madagascar
-
 Malaysia
-
 Malta
-
 Mauritius
-
 Mexico
-
 Moldova
-
 Mongolia
-
 Montenegro
-
 Morocco
-
 Mozambique
-
 Myanmar
-
 Namibia
-
 Nepal
-
 Netherlands
-
 New Zealand
-
 Nigeria
-
 North Macedonia
-
 Norway
-
 Oman
-
 Pakistan
-
 Palestine
-
 Panama
-
 Papua New Guinea
-
 Paraguay
-
 Peru
-
 Philippines
-
 Poland
-
 Portugal
-
 Puerto Rico
-
 Qatar
-
 Reunion
-
 Romania
-
 Rwanda
-
 Saudi Arabia
-
 Serbia
-
 Singapore
-
 Slovakia
-
 Slovenia
-
 Somalia
-
 South Africa
-
 Spain
-
 Sri Lanka
-
 Sweden
-
 Switzerland
-
 Syria
-
 Taiwan
-
 Tajikistan
-
 Tanzania
-
 Thailand
-
 Trinidad and Tobago
-
 Tunisia
-
 Turkey
-
 UAE
-
 Uganda
-
 Ukraine
-
 United Kingdom
-
United States
-
 Uruguay
-
 Uzbekistan
-
 Venezuela
-
 Vietnam
-
 Yemen
-
 Zambia
-
 Zimbabwe
- Forex
- Crypto












