


Robinhood Markets Inc (HOOD) slid 3.09% as sellers took control following a gap higher at the open, even as strong Q2 earnings and new fintech service expansion marked a positive backdrop. The pullback is reinforced by a break below the 20-day moving average and mixed momentum signals, suggesting short-term weakness amid a still-bullish broader trend.
 73.98
79.76
Highlights
- Robinhood delivered strong Q2 results, reporting expansion in digital finance and $25 billion in customer crypto assets in custody.
- Company activity in blockchain and memecoin trading has not directly influenced stock operations, as the share price remains under broad selling pressure.
- Robinhood stock trades below its 20-day average, with mixed technical indicators and an expected five-day range of $104.47 to $112.66.
Price action pressured by disputed crypto claims and service expansion
Robinhood Markets Inc reported strong results in its Q2 financial technology earnings. The company has been expanding its fintech services, responding to increased demand for digital finance. Claims of a $25 million Bitcoin purchase were contradicted by official disclosures showing around $25 billion in customer crypto assets held in custody. Other mentions of blockchain and memecoin trading have not been tied directly to stock operations, though price action has remained under broader selling pressure.
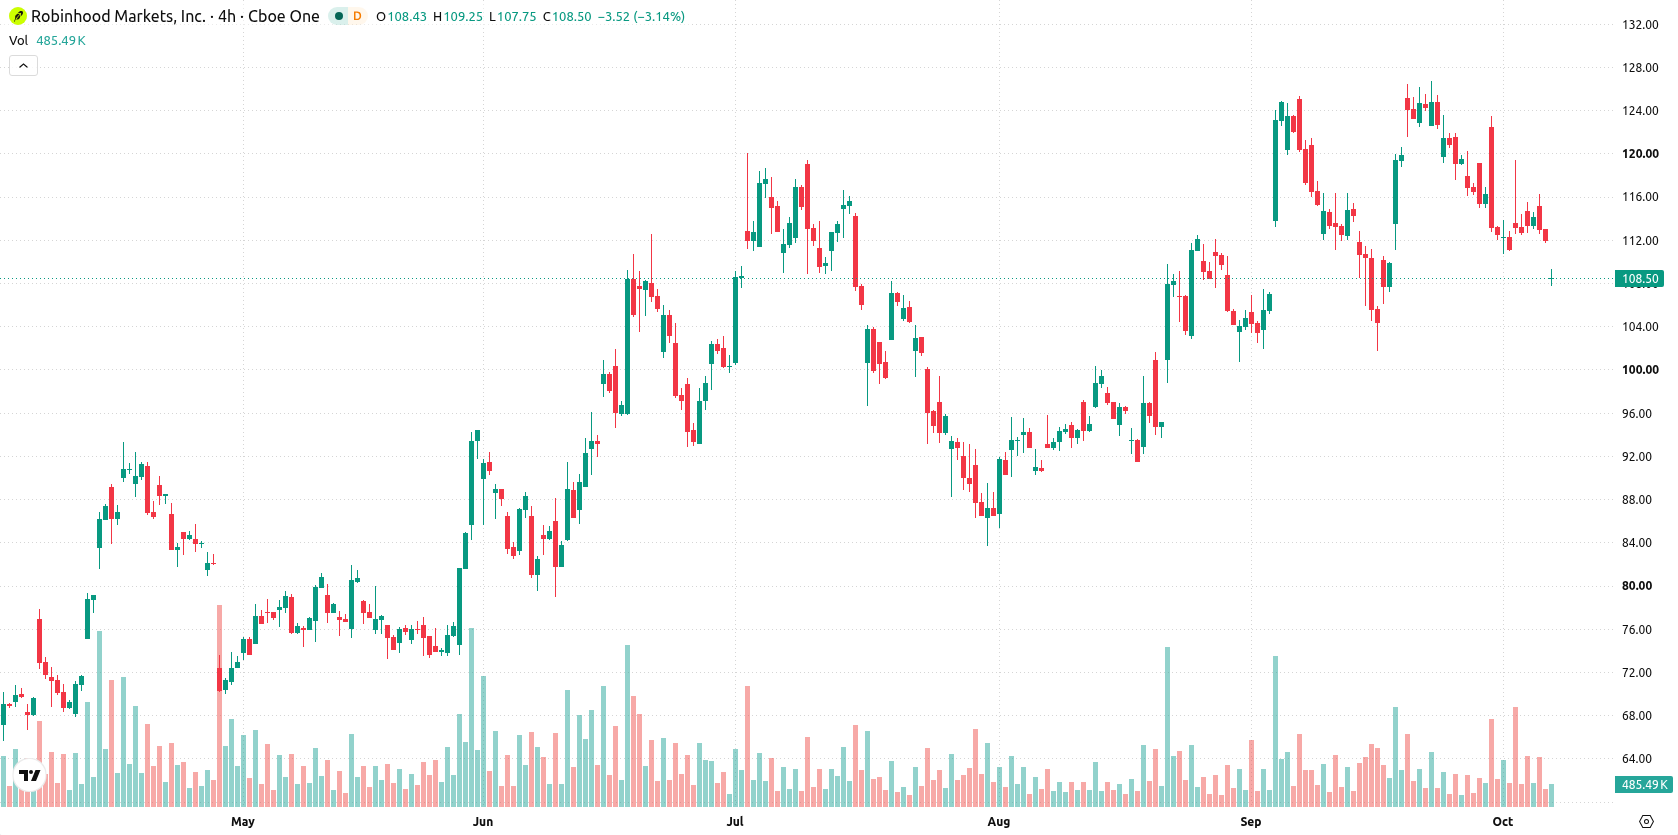
Short-term weakness as mixed momentum collides with strong support
Robinhood is trading below its 20-day moving average at $115.27 yet remains above its 50-day at $106.1 and 200-day at $94.28. Resistance is set at $110.73 with support at $106.1, while the overall structure signals short-term weakness but intact medium- and long-term bullish trends. Oscillators paint a mixed picture: MACD signals a strong buy, the ADX trend is neutral with weak strength, RSI sits mid-range at 48.76 with a sell signal, and Stochastic RSI is deeply oversold at 6.69. CCI is slightly negative but neutral, while Bull/Bear Power is positive at 1.67, showing buyers dominate intraday but conditions are overbought.
Earlier, it was reported that Robinhood's purchase of $25 million in Bitcoin reflected its ongoing strategic focus on cryptocurrency and digital assets. As the current analysis highlights mixed momentum signals and a technical breakdown below the 20-day moving average, traders should watch for consolidation within the $104.47 to $112.66 volatility band amid heightened uncertainty in the near term.






Latest Robinhood News




-
 Afghanistan
-
 Albania
-
 Algeria
-
 Angola
-
 Argentina
-
 Armenia
-
 Australia
-
 Austria
-
 Azerbaijan
-
 Bahamas
-
 Bahrain
-
 Bangladesh
-
 Belarus
-
 Belgium
-
 Bolivia
-
 Botswana
-
 Brazil
-
 Brunei
-
 Bulgaria
-
 Cambodia
-
 Cameroon
-
 Canada
-
 Chile
-
 China
-
 Colombia
-
 Congo
-
 Costa Rica
-
 Cote d'Ivoire
-
 Croatia
-
 Cuba
-
 Cyprus
-
 Czechia
-
 DR Congo
-
 Denmark
-
 Dominican Republic
-
 Ecuador
-
 Egypt
-
 El Salvador
-
 Estonia
-
 Eswatini
-
 Ethiopia
-
 Finland
-
 France
-
 Georgia
-
 Germany
-
 Ghana
-
 Greece
-
 Haiti
-
 Hong Kong
-
 Hungary
-
 India
-
 Indonesia
-
 Iran, Islamic republic
-
 Iraq
-
 Ireland
-
 Israel
-
 Italy
-
 Jamaica
-
 Japan
-
 Jordan
-
 Kazakhstan
-
 Kenya
-
 Korea
-
 Kuwait
-
 Kyrgyzstan
-
 Laos
-
 Latvia
-
 Lebanon
-
 Lesotho
-
 Libya
-
 Lithuania
-
 Luxembourg
-
 Madagascar
-
 Malaysia
-
 Malta
-
 Mauritius
-
 Mexico
-
 Moldova
-
 Mongolia
-
 Montenegro
-
 Morocco
-
 Mozambique
-
 Myanmar
-
 Namibia
-
 Nepal
-
 Netherlands
-
 New Zealand
-
 Nigeria
-
 North Macedonia
-
 Norway
-
 Oman
-
 Pakistan
-
 Palestine
-
 Panama
-
 Papua New Guinea
-
 Paraguay
-
 Peru
-
 Philippines
-
 Poland
-
 Portugal
-
 Puerto Rico
-
 Qatar
-
 Reunion
-
 Romania
-
 Rwanda
-
 Saudi Arabia
-
 Serbia
-
 Singapore
-
 Slovakia
-
 Slovenia
-
 Somalia
-
 South Africa
-
 Spain
-
 Sri Lanka
-
 Sweden
-
 Switzerland
-
 Syria
-
 Taiwan
-
 Tajikistan
-
 Tanzania
-
 Thailand
-
 Trinidad and Tobago
-
 Tunisia
-
 Turkey
-
 UAE
-
 Uganda
-
 Ukraine
-
 United Kingdom
-
United States
-
 Uruguay
-
 Uzbekistan
-
 Venezuela
-
 Vietnam
-
 Yemen
-
 Zambia
-
 Zimbabwe
- Forex
- Crypto












