


Hut 8 (HUT) stock is trading at $87.86, reflecting a daily decline of 4.6%. The price is currently positioned below its short- and medium-term moving averages, but remains above longer-term trend measures.
 58.31
57.21
Highlights
- HUT/USD trades below key short- and medium-term moving averages, indicating persistent seller pressure despite long-term structural support.
- Momentum is mixed with some buyer signals, but overbought oscillator readings and high volatility raise risk of buyer exhaustion.
- Near-term price is expected to consolidate between $82.82 and $94.21, with a high likelihood of a move lower and very low probability of sustained recovery.
Mixed momentum and resistance as overbought signals heighten risk
On the technical front, HUT is trading below the MA-20 at $89.28 and the MA-50 at $89.88 on the hourly chart, while remaining above the MA-200 at $80.77. The Ichimoku Kijun at $87.94 forms immediate resistance. MACD signals Buy and RSI is also on Buy, but Stoch RSI, CCI, and Bull/Bear Power all indicate overbought conditions. ADX is Neutral. This combination highlights mixed momentum signals, with buyer dominance intraday alongside elevated exhaustion risks and strong volatility.
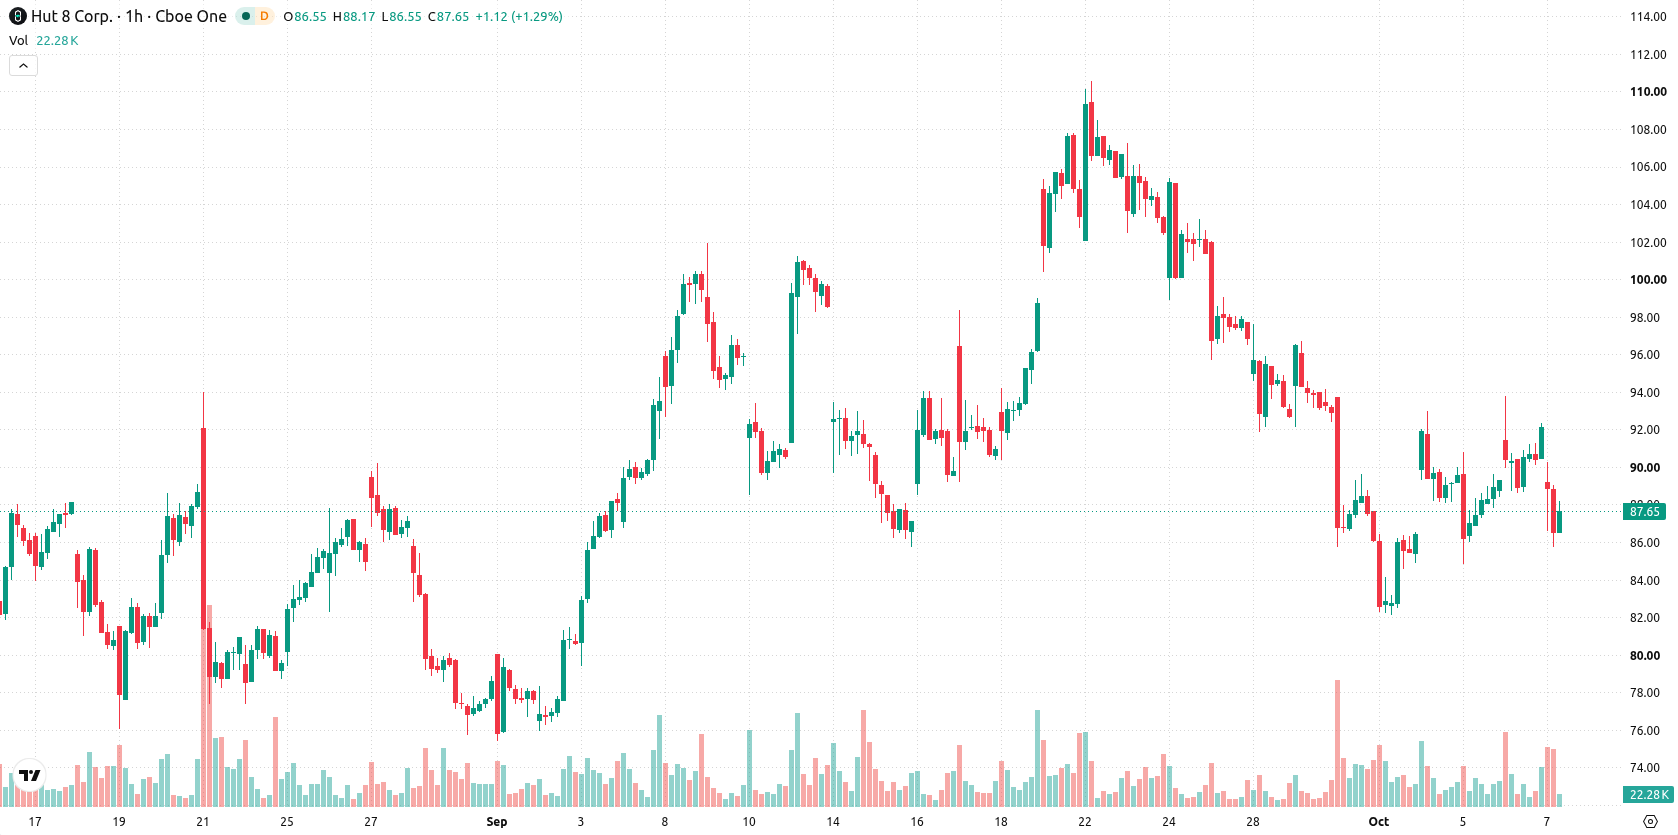
Downside pressure persists as consolidation anchors short-term outlook
In the short term, price is expected to consolidate within the $82.82 to $94.21 band, reflecting typical volatility. The probability of a move upward is very low, while the likelihood of further losses is high. Baseline scenario sees consolidation near current levels. An upside scenario would require a break above the Ichimoku Kijun, while further downside may follow a break below $82.82 support.
Earlier, analysts noted that Hut 8 was exhibiting price strength supported by institutional trading flows, but with technical headwinds leading to a cautious outlook. The current setup signals a shift toward increased downside risk, making a break below the $82.82 support level a critical threshold for traders to monitor in the sessions ahead.











-
 Afghanistan
-
 Albania
-
 Algeria
-
 Angola
-
 Argentina
-
 Armenia
-
 Australia
-
 Austria
-
 Azerbaijan
-
 Bahamas
-
 Bahrain
-
 Bangladesh
-
 Belarus
-
 Belgium
-
 Bolivia
-
 Botswana
-
 Brazil
-
 Brunei
-
 Bulgaria
-
 Cambodia
-
 Cameroon
-
 Canada
-
 Chile
-
 China
-
 Colombia
-
 Congo
-
 Costa Rica
-
 Cote d'Ivoire
-
 Croatia
-
 Cuba
-
 Cyprus
-
 Czechia
-
 DR Congo
-
 Denmark
-
 Dominican Republic
-
 Ecuador
-
 Egypt
-
 El Salvador
-
 Estonia
-
 Eswatini
-
 Ethiopia
-
 Finland
-
 France
-
 Georgia
-
 Germany
-
 Ghana
-
 Greece
-
 Haiti
-
 Hong Kong
-
 Hungary
-
 India
-
 Indonesia
-
 Iran, Islamic republic
-
 Iraq
-
 Ireland
-
 Israel
-
 Italy
-
 Jamaica
-
 Japan
-
 Jordan
-
 Kazakhstan
-
 Kenya
-
 Korea
-
 Kuwait
-
 Kyrgyzstan
-
 Laos
-
 Latvia
-
 Lebanon
-
 Lesotho
-
 Libya
-
 Lithuania
-
 Luxembourg
-
 Madagascar
-
 Malaysia
-
 Malta
-
 Mauritius
-
 Mexico
-
 Moldova
-
 Mongolia
-
 Montenegro
-
 Morocco
-
 Mozambique
-
 Myanmar
-
 Namibia
-
 Nepal
-
 Netherlands
-
 New Zealand
-
 Nigeria
-
 North Macedonia
-
 Norway
-
 Oman
-
 Pakistan
-
 Palestine
-
 Panama
-
 Papua New Guinea
-
 Paraguay
-
 Peru
-
 Philippines
-
 Poland
-
 Portugal
-
 Puerto Rico
-
 Qatar
-
 Reunion
-
 Romania
-
 Rwanda
-
 Saudi Arabia
-
 Serbia
-
 Singapore
-
 Slovakia
-
 Slovenia
-
 Somalia
-
 South Africa
-
 Spain
-
 Sri Lanka
-
 Sweden
-
 Switzerland
-
 Syria
-
 Taiwan
-
 Tajikistan
-
 Tanzania
-
 Thailand
-
 Trinidad and Tobago
-
 Tunisia
-
 Turkey
-
 UAE
-
 Uganda
-
 Ukraine
-
 United Kingdom
-
United States
-
 Uruguay
-
 Uzbekistan
-
 Venezuela
-
 Vietnam
-
 Yemen
-
 Zambia
-
 Zimbabwe
- Forex
- Crypto












