

Epcoritamab plus R-CHOP Phase 3 results: Can AbbVie stock break $279.47 resistance?

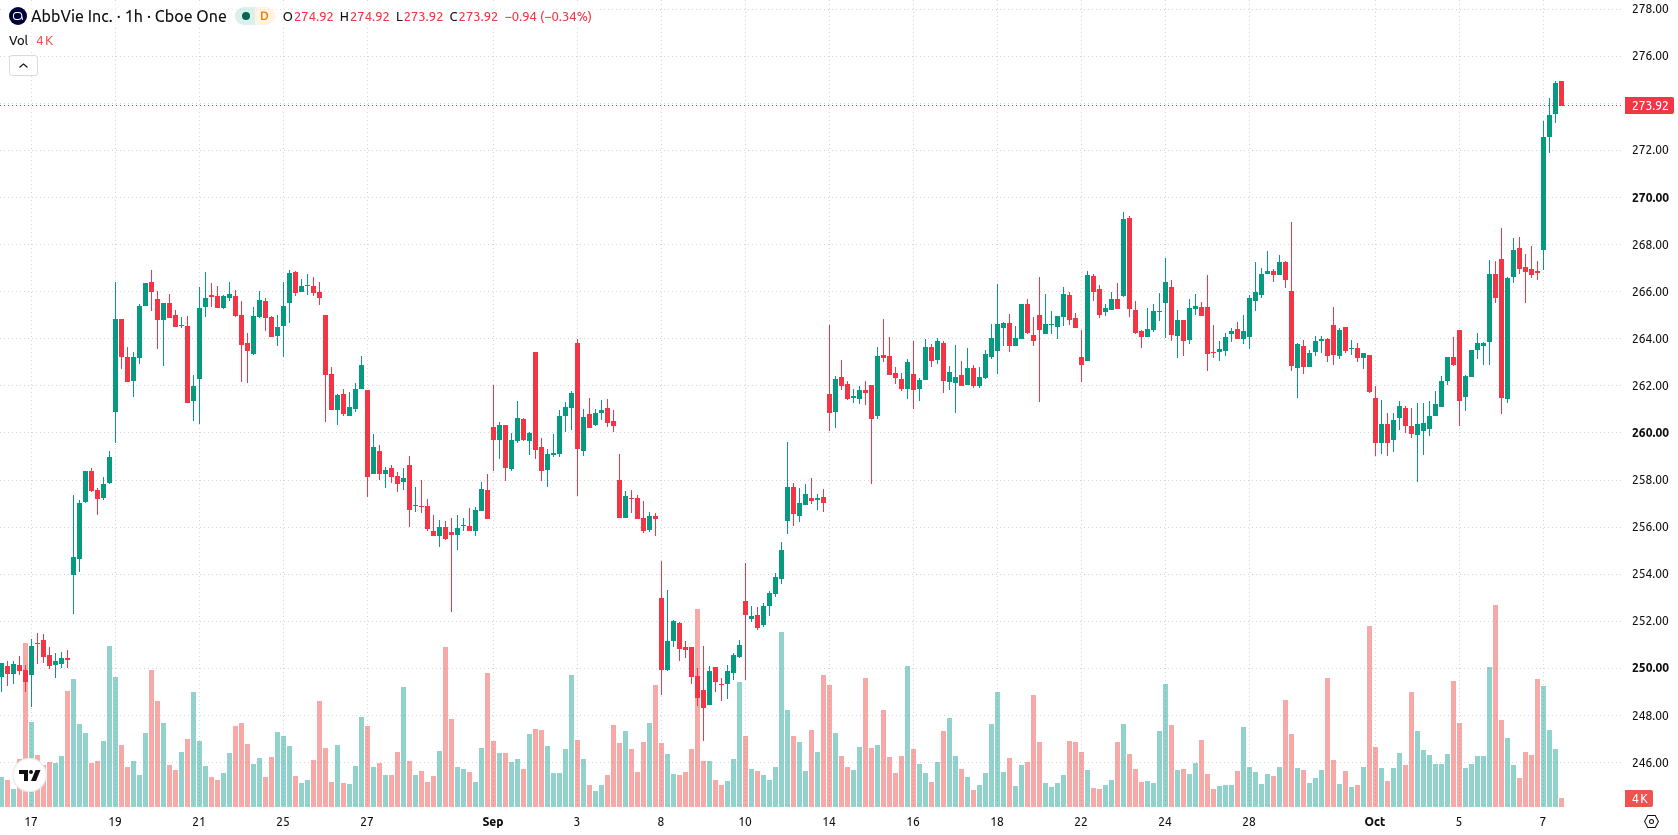
AbbVie Inc. (ABBV) stock is trading at $274.75, up 3.02% for the day. The price stands firmly above its key moving averages, reflecting strong near-term momentum.
 297.25
300.42
Highlights
- AbbVie and Genmab reported their epcoritamab plus R-CHOP regimen reduced risk of disease progression or death by 51% in Phase 3 diffuse large B-cell lymphoma trials.
- The successful trial result brings renewed market focus to AbbVie’s oncology portfolio and the company’s role in novel patient therapies.
- Shares of AbbVie climbed to $274.75, gaining 3.02% on strong bullish momentum, with a projected trading range of $270.03 to $279.47 and overbought signals suggesting a near-term pause.
Positive trial data boosts sentiment as oncology leadership expands
AbbVie and Genmab have reported successful Phase 3 trial outcomes for their epcoritamab plus R-CHOP regimen in newly diagnosed diffuse large B-cell lymphoma, showing a 51% reduction in risk of disease progression or death compared to standard treatment, according to Finance Yahoo. This significant clinical result is driving renewed interest in AbbVie's expanding oncology portfolio by underlining the company's leadership in delivering novel therapies with tangible patient outcomes. As investors respond to the robust data, the news acts as a catalyst for positive sentiment and supports further enthusiasm in the market.
Bullish momentum persists as overbought signals hint at pause risk
On the technical front, price action remains robust above the MA-20 of $264.59 and MA-50 of $263.73 on the hourly chart, and well above the MA-200 at $231.94 on the daily timeframe. The Ichimoku Kijun sits at $264.39 and now serves as immediate support. MACD continues to show a Buy bias, while ADX appears neutral. RSI at 67.45 signals sustained bullishness, but Stoch RSI, CCI, and Bull/Bear Power all point to overbought conditions and prevailing buyer dominance during intraday trading. The Awesome Oscillator reinforces the current bullish trend, though the convergence of overbought signals highlights an emerging divergence and the possibility of a short-term pause.
Sideways trading forecast as volatility boundaries limit price breakout
Looking ahead, ABBV is expected to remain range-bound over the next 2–3 trading days within a typical volatility band between $270.03 and $279.47. Based on current momentum and indicator setups, the probability of further upside moves is estimated at 79%, with a 21% chance of a pullback. The baseline scenario anticipates sideways trading within this range. A close above $279.47 could trigger additional gains, while a break below $270.03 would signal a short-term reversal and test immediate support.
Earlier, analysts noted that AbbVie was likely to maintain an upward bias supported by regulatory progress and pipeline developments. The latest clinical trial success and continued technical strength further reinforce the prevailing bullish scenario, with attention now on price action near the $279.47 resistance level as a possible catalyst for additional upside movement.










-
 Afghanistan
-
 Albania
-
 Algeria
-
 Angola
-
 Argentina
-
 Armenia
-
 Australia
-
 Austria
-
 Azerbaijan
-
 Bahamas
-
 Bahrain
-
 Bangladesh
-
 Belarus
-
 Belgium
-
 Bolivia
-
 Botswana
-
 Brazil
-
 Brunei
-
 Bulgaria
-
 Cambodia
-
 Cameroon
-
 Canada
-
 Chile
-
 China
-
 Colombia
-
 Congo
-
 Costa Rica
-
 Cote d'Ivoire
-
 Croatia
-
 Cuba
-
 Cyprus
-
 Czechia
-
 DR Congo
-
 Denmark
-
 Dominican Republic
-
 Ecuador
-
 Egypt
-
 El Salvador
-
 Estonia
-
 Eswatini
-
 Ethiopia
-
 Finland
-
 France
-
 Georgia
-
 Germany
-
 Ghana
-
 Greece
-
 Haiti
-
 Hong Kong
-
 Hungary
-
 India
-
 Indonesia
-
 Iran, Islamic republic
-
 Iraq
-
 Ireland
-
 Israel
-
 Italy
-
 Jamaica
-
 Japan
-
 Jordan
-
 Kazakhstan
-
 Kenya
-
 Korea
-
 Kuwait
-
 Kyrgyzstan
-
 Laos
-
 Latvia
-
 Lebanon
-
 Lesotho
-
 Libya
-
 Lithuania
-
 Luxembourg
-
 Madagascar
-
 Malaysia
-
 Malta
-
 Mauritius
-
 Mexico
-
 Moldova
-
 Mongolia
-
 Montenegro
-
 Morocco
-
 Mozambique
-
 Myanmar
-
 Namibia
-
 Nepal
-
 Netherlands
-
 New Zealand
-
 Nigeria
-
 North Macedonia
-
 Norway
-
 Oman
-
 Pakistan
-
 Palestine
-
 Panama
-
 Papua New Guinea
-
 Paraguay
-
 Peru
-
 Philippines
-
 Poland
-
 Portugal
-
 Puerto Rico
-
 Qatar
-
 Reunion
-
 Romania
-
 Rwanda
-
 Saudi Arabia
-
 Serbia
-
 Singapore
-
 Slovakia
-
 Slovenia
-
 Somalia
-
 South Africa
-
 Spain
-
 Sri Lanka
-
 Sweden
-
 Switzerland
-
 Syria
-
 Taiwan
-
 Tajikistan
-
 Tanzania
-
 Thailand
-
 Trinidad and Tobago
-
 Tunisia
-
 Turkey
-
 UAE
-
 Uganda
-
 Ukraine
-
 United Kingdom
-
United States
-
 Uruguay
-
 Uzbekistan
-
 Venezuela
-
 Vietnam
-
 Yemen
-
 Zambia
-
 Zimbabwe
- Forex
- Crypto












