

Why is Riot Platforms stock falling today? Seller pressure drives move lower

Riot Platforms (RIOT) stock is trading at $18.27 after a daily decline of 3.49%. The price is currently positioned below its key moving averages, reflecting short-term and medium-term weakness.
 12.92
14.44
Highlights
- Riot Platforms fully repaid and terminated its up to $200 million secured term loan facility with Coinbase Credit on September 21, 2026.
- This repayment released previously pledged bitcoin, USDC, and cash collateral, enhancing Riot Platforms stock's liquidity and financial flexibility.
- Shares of Riot Platforms trade below key moving averages with technical indicators bearish and an expected price range of $16.86 to $19.29 over the next two to three days.
Balance sheet improves as debt facility repaid amid selling pressure
On September 21, 2026, Riot Platforms, Inc. completed full repayment and termination of its up to US$200 million secured term loan facility with Coinbase Credit, according to Finance Yahoo. This action settled all outstanding principal and interest, resulting in the release of bitcoin, USDC, and cash that had previously been pledged as collateral, thereby improving the company’s financial flexibility. While the move strengthens Riot's balance sheet and liquidity profile, price action has remained under broader selling pressure.
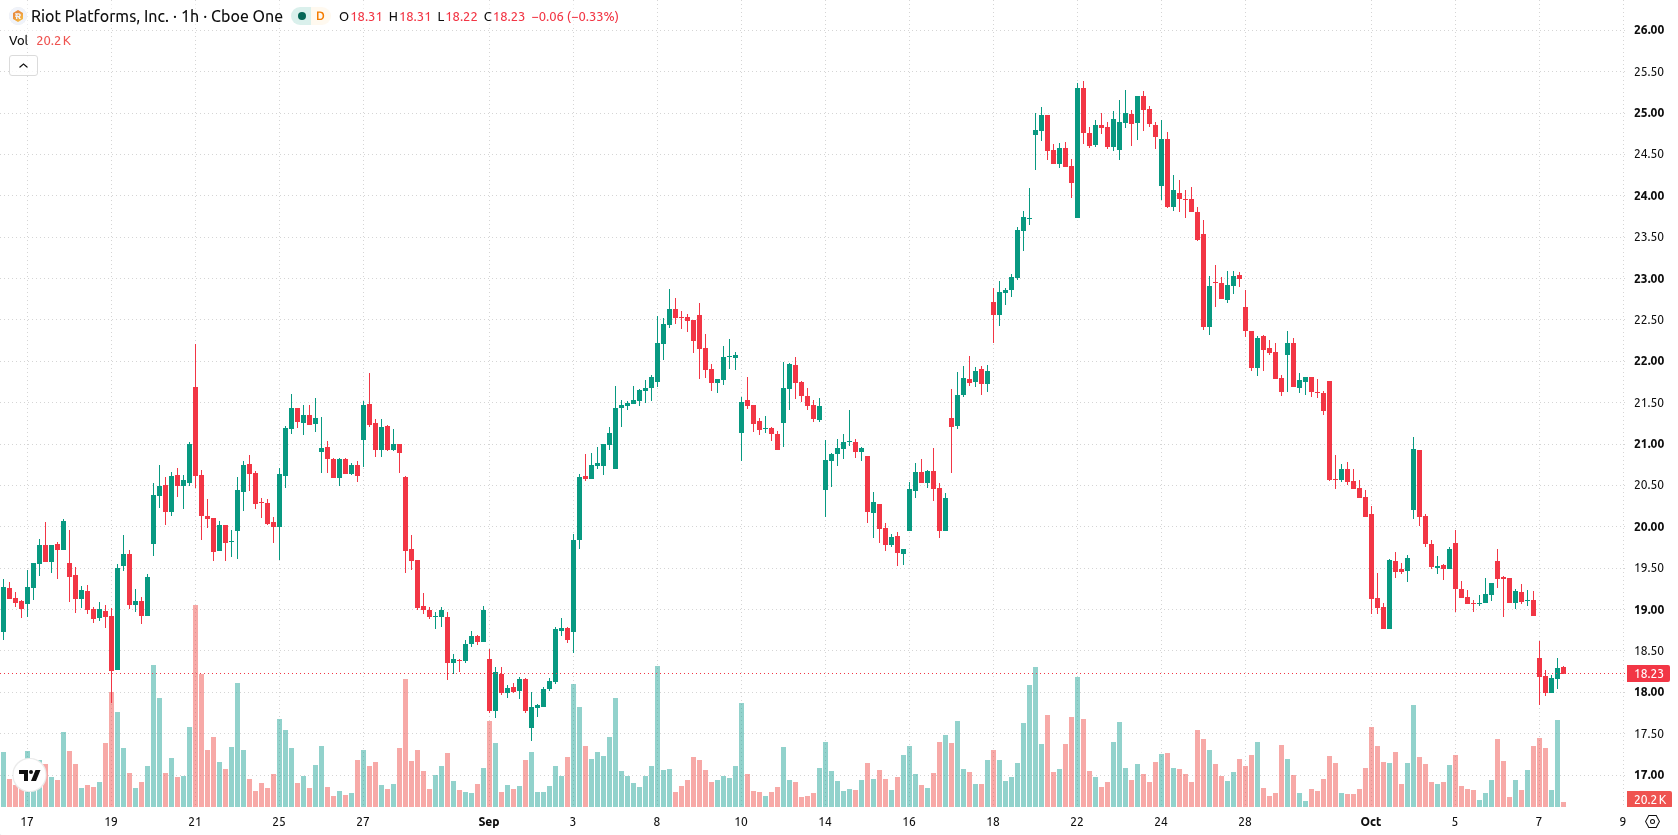
Oversold signals deepen as technical levels reinforce seller control
RIOT has moved below the MA-20 at $19.07, the MA-50 at $20.05, and the MA-200 at $19.4, highlighting continued technical weakness. The Ichimoku Kijun level stands as immediate resistance at $19.46. Momentum readings are predominantly bearish, with MACD and ADX flagging a sell bias, while RSI sits deeply oversold at 29.64. Both CCI and Bull/Bear Power are also in oversold territory. However, Stoch RSI’s strong buy signal suggests a potential reversal attempt, though this is not yet confirmed. Seller dominance is reinforced by the negative Bull/Bear Power reading, and the Awesome Oscillator remains aligned with the current downtrend; overall, short-term sentiment remains mixed but skewed to the downside.
Downside risk prevails as volatility narrows and breakout odds fall
Over the next two to three trading days, RIOT is expected to fluctuate within a range of $16.86 to $19.29, defining the typical volatility band relative to current levels. The probability of an upward move is low at 22%, while a downward scenario is more likely at 78%. The baseline scenario sees consolidation within this corridor. A bullish breakout above immediate resistance could prompt a rebound, while further losses would be triggered if price decisively breaks below support.
Earlier, analysts noted that Riot Platforms was experiencing sustained technical weakness and persistent downside momentum. This analysis is reinforced by the latest data, with bearish signals and a high probability of further declines spotlighting the $16.86 support as a crucial level to monitor in the near term.









-
 Afghanistan
-
 Albania
-
 Algeria
-
 Angola
-
 Argentina
-
 Armenia
-
 Australia
-
 Austria
-
 Azerbaijan
-
 Bahamas
-
 Bahrain
-
 Bangladesh
-
 Belarus
-
 Belgium
-
 Bolivia
-
 Botswana
-
 Brazil
-
 Brunei
-
 Bulgaria
-
 Cambodia
-
 Cameroon
-
 Canada
-
 Chile
-
 China
-
 Colombia
-
 Congo
-
 Costa Rica
-
 Cote d'Ivoire
-
 Croatia
-
 Cuba
-
 Cyprus
-
 Czechia
-
 DR Congo
-
 Denmark
-
 Dominican Republic
-
 Ecuador
-
 Egypt
-
 El Salvador
-
 Estonia
-
 Eswatini
-
 Ethiopia
-
 Finland
-
 France
-
 Georgia
-
 Germany
-
 Ghana
-
 Greece
-
 Haiti
-
 Hong Kong
-
 Hungary
-
 India
-
 Indonesia
-
 Iran, Islamic republic
-
 Iraq
-
 Ireland
-
 Israel
-
 Italy
-
 Jamaica
-
 Japan
-
 Jordan
-
 Kazakhstan
-
 Kenya
-
 Korea
-
 Kuwait
-
 Kyrgyzstan
-
 Laos
-
 Latvia
-
 Lebanon
-
 Lesotho
-
 Libya
-
 Lithuania
-
 Luxembourg
-
 Madagascar
-
 Malaysia
-
 Malta
-
 Mauritius
-
 Mexico
-
 Moldova
-
 Mongolia
-
 Montenegro
-
 Morocco
-
 Mozambique
-
 Myanmar
-
 Namibia
-
 Nepal
-
 Netherlands
-
 New Zealand
-
 Nigeria
-
 North Macedonia
-
 Norway
-
 Oman
-
 Pakistan
-
 Palestine
-
 Panama
-
 Papua New Guinea
-
 Paraguay
-
 Peru
-
 Philippines
-
 Poland
-
 Portugal
-
 Puerto Rico
-
 Qatar
-
 Reunion
-
 Romania
-
 Rwanda
-
 Saudi Arabia
-
 Serbia
-
 Singapore
-
 Slovakia
-
 Slovenia
-
 Somalia
-
 South Africa
-
 Spain
-
 Sri Lanka
-
 Sweden
-
 Switzerland
-
 Syria
-
 Taiwan
-
 Tajikistan
-
 Tanzania
-
 Thailand
-
 Trinidad and Tobago
-
 Tunisia
-
 Turkey
-
 UAE
-
 Uganda
-
 Ukraine
-
 United Kingdom
-
United States
-
 Uruguay
-
 Uzbekistan
-
 Venezuela
-
 Vietnam
-
 Yemen
-
 Zambia
-
 Zimbabwe
- Forex
- Crypto












