

Why is NetApp stock up today? Novus AI platform launch and buyer support drive rally

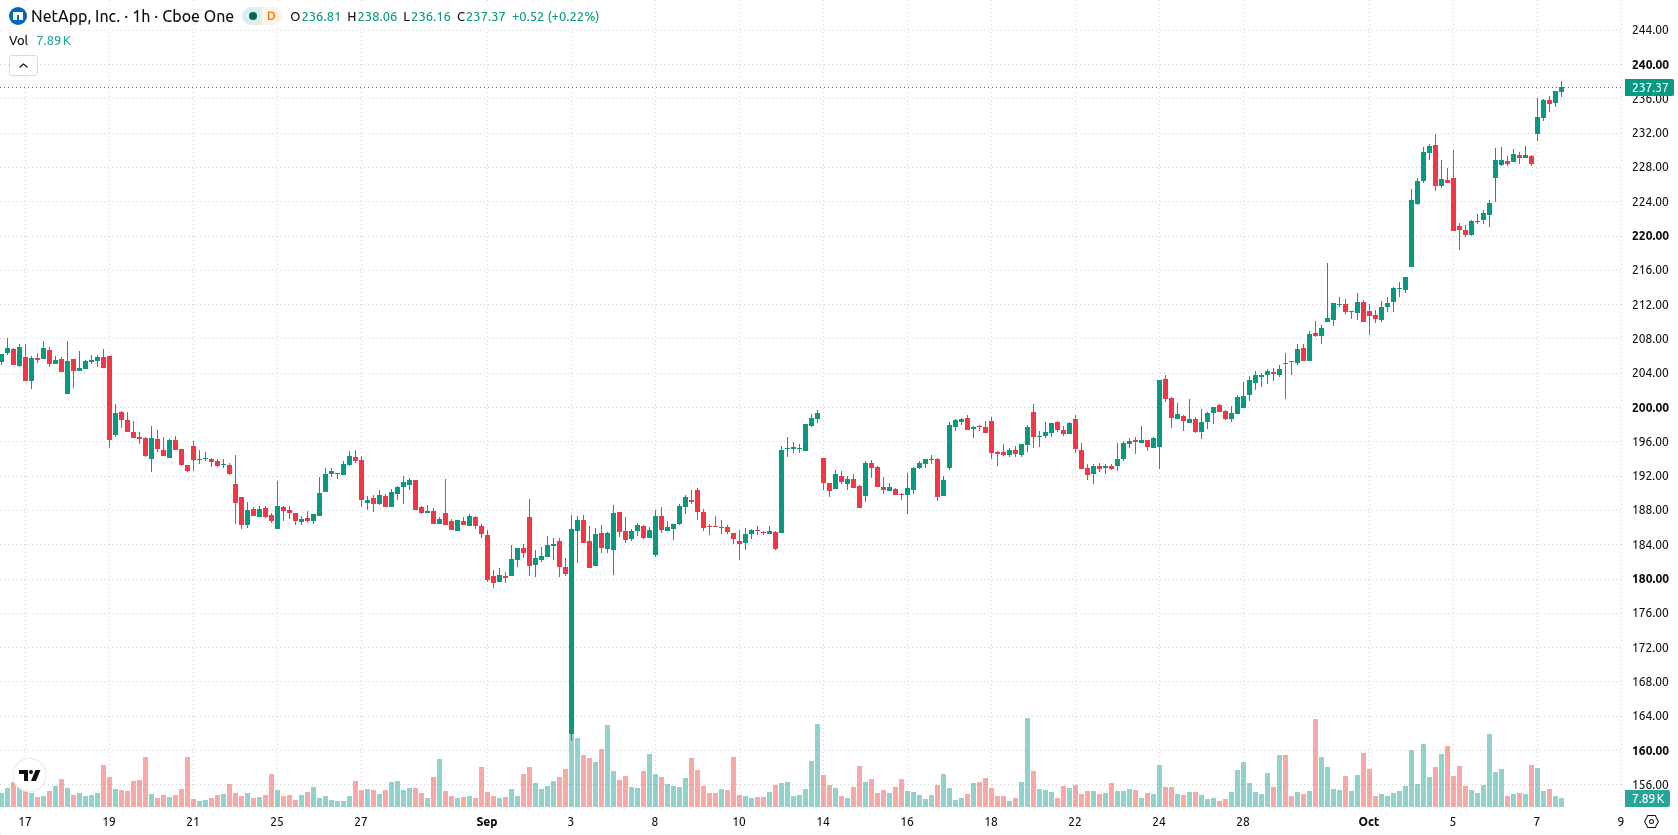
NetApp (NTAP) stock is trading at $237.2, gaining 3.83% on the day. The price stands above its key moving averages, reflecting strong intraday upside in the context of a moderate-volatility session.
 209.58
231.49
Highlights
- NetApp plans a $0.52 per share quarterly dividend with an ex-dividend date of October 9, 2026 and payment on October 28, 2026.
- NetApp introduces the Novus AI-focused storage platform and launches new enterprise partnerships in multi-cloud and AI storage integration.
- Shares of NetApp gained 3.83% to $237.2 and trade near the top of today’s range, with momentum indicators positive but overbought, targeting a price corridor of $226.91 to $247.49.
Dividend incentives and AI expansion drive demand despite insider selling
NetApp’s upcoming $0.52 per share quarterly dividend, with an ex-dividend date of October 9, 2026 and payment due on October 28, 2026, provides a direct incentive for investors to hold shares and supports demand ahead of key record dates. The company has also announced the launch of its Novus AI-focused storage platform, unlocking a new product segment designed for enterprise AI workloads and signaling deeper engagement with high-growth markets. In addition, new partnerships aimed at multi-cloud and AI storage integration broaden NetApp’s strategic footprint. Recent insider selling, specifically director Carrie Palin’s sale of 5,000 shares for $1,082,150 on October 2, 2026 as reported by MarketBeat, introduces a secondary factor that may influence short-term sentiment.
Bullish momentum holds above key support amid overbought technicals
On the technical side, NTAP is holding above its MA-20 at $226.61 and MA-50 at $217.03 on the hourly chart, with price levels materially above the long-term MA-200 at $139.91. Immediate support is defined by the Ichimoku Kijun level near $223.63. Momentum-driven indicators, including MACD and ADX, remain bullish, while RSI, CCI, and Stoch RSI are all in overbought territory and Bull/Bear Power shows strong buyer dominance. The Awesome Oscillator remains positive, confirming the upward bias, but overbought signals suggest caution for new entrants near the current price.
Upward price bias maintained as consolidation range guides short-term risk
In the short term, the likely price range for NTAP is forecast at $226.91–$247.49, which reflects the asset's typical volatility band relative to current levels. There is a 79% probability of continued upward movement, so the baseline view expects consolidation within this corridor. If the price breaks above $247.49, additional highs may be targeted, while a close below $226.91 could signal the start of a deeper pullback as support is breached.
Earlier, analysts noted that strong demand for NetApp’s core and AI-driven storage offerings could position the company for sustained growth within the broader data infrastructure sector. The recent launch of the Novus AI platform and expansion into multi-cloud partnerships reinforces this longer-term outlook, with the $226.91–$247.49 trading corridor now serving as the immediate technical range to monitor for potential momentum shifts.










-
 Afghanistan
-
 Albania
-
 Algeria
-
 Angola
-
 Argentina
-
 Armenia
-
 Australia
-
 Austria
-
 Azerbaijan
-
 Bahamas
-
 Bahrain
-
 Bangladesh
-
 Belarus
-
 Belgium
-
 Bolivia
-
 Botswana
-
 Brazil
-
 Brunei
-
 Bulgaria
-
 Cambodia
-
 Cameroon
-
 Canada
-
 Chile
-
 China
-
 Colombia
-
 Congo
-
 Costa Rica
-
 Cote d'Ivoire
-
 Croatia
-
 Cuba
-
 Cyprus
-
 Czechia
-
 DR Congo
-
 Denmark
-
 Dominican Republic
-
 Ecuador
-
 Egypt
-
 El Salvador
-
 Estonia
-
 Eswatini
-
 Ethiopia
-
 Finland
-
 France
-
 Georgia
-
 Germany
-
 Ghana
-
 Greece
-
 Haiti
-
 Hong Kong
-
 Hungary
-
 India
-
 Indonesia
-
 Iran, Islamic republic
-
 Iraq
-
 Ireland
-
 Israel
-
 Italy
-
 Jamaica
-
 Japan
-
 Jordan
-
 Kazakhstan
-
 Kenya
-
 Korea
-
 Kuwait
-
 Kyrgyzstan
-
 Laos
-
 Latvia
-
 Lebanon
-
 Lesotho
-
 Libya
-
 Lithuania
-
 Luxembourg
-
 Madagascar
-
 Malaysia
-
 Malta
-
 Mauritius
-
 Mexico
-
 Moldova
-
 Mongolia
-
 Montenegro
-
 Morocco
-
 Mozambique
-
 Myanmar
-
 Namibia
-
 Nepal
-
 Netherlands
-
 New Zealand
-
 Nigeria
-
 North Macedonia
-
 Norway
-
 Oman
-
 Pakistan
-
 Palestine
-
 Panama
-
 Papua New Guinea
-
 Paraguay
-
 Peru
-
 Philippines
-
 Poland
-
 Portugal
-
 Puerto Rico
-
 Qatar
-
 Reunion
-
 Romania
-
 Rwanda
-
 Saudi Arabia
-
 Serbia
-
 Singapore
-
 Slovakia
-
 Slovenia
-
 Somalia
-
 South Africa
-
 Spain
-
 Sri Lanka
-
 Sweden
-
 Switzerland
-
 Syria
-
 Taiwan
-
 Tajikistan
-
 Tanzania
-
 Thailand
-
 Trinidad and Tobago
-
 Tunisia
-
 Turkey
-
 UAE
-
 Uganda
-
 Ukraine
-
 United Kingdom
-
United States
-
 Uruguay
-
 Uzbekistan
-
 Venezuela
-
 Vietnam
-
 Yemen
-
 Zambia
-
 Zimbabwe
- Forex
- Crypto












