


Hut 8 Corp (HUT) came under renewed selling pressure Wednesday, dropping 2.95% as short- and medium-term technical momentum weighed on price action. The move is supported by the stock remaining below its 20-day and 50-day moving averages, signaling persistent weakness despite a still-bullish long-term trend structure.
 58.31
57.21
Highlights
- Hut 8 stock is trading below key short- and medium-term moving averages but remains above its long-term average, indicating current selling pressure within a supportive larger trend.
- Momentum and oscillators issue mixed to neutral signals with no broad overbought or oversold condition and only modest intraday buying strength.
- Over the next five trading days, price is projected in a $83.42 to $95.02 range with near-term resistance at $90.1 and support at $85.82.
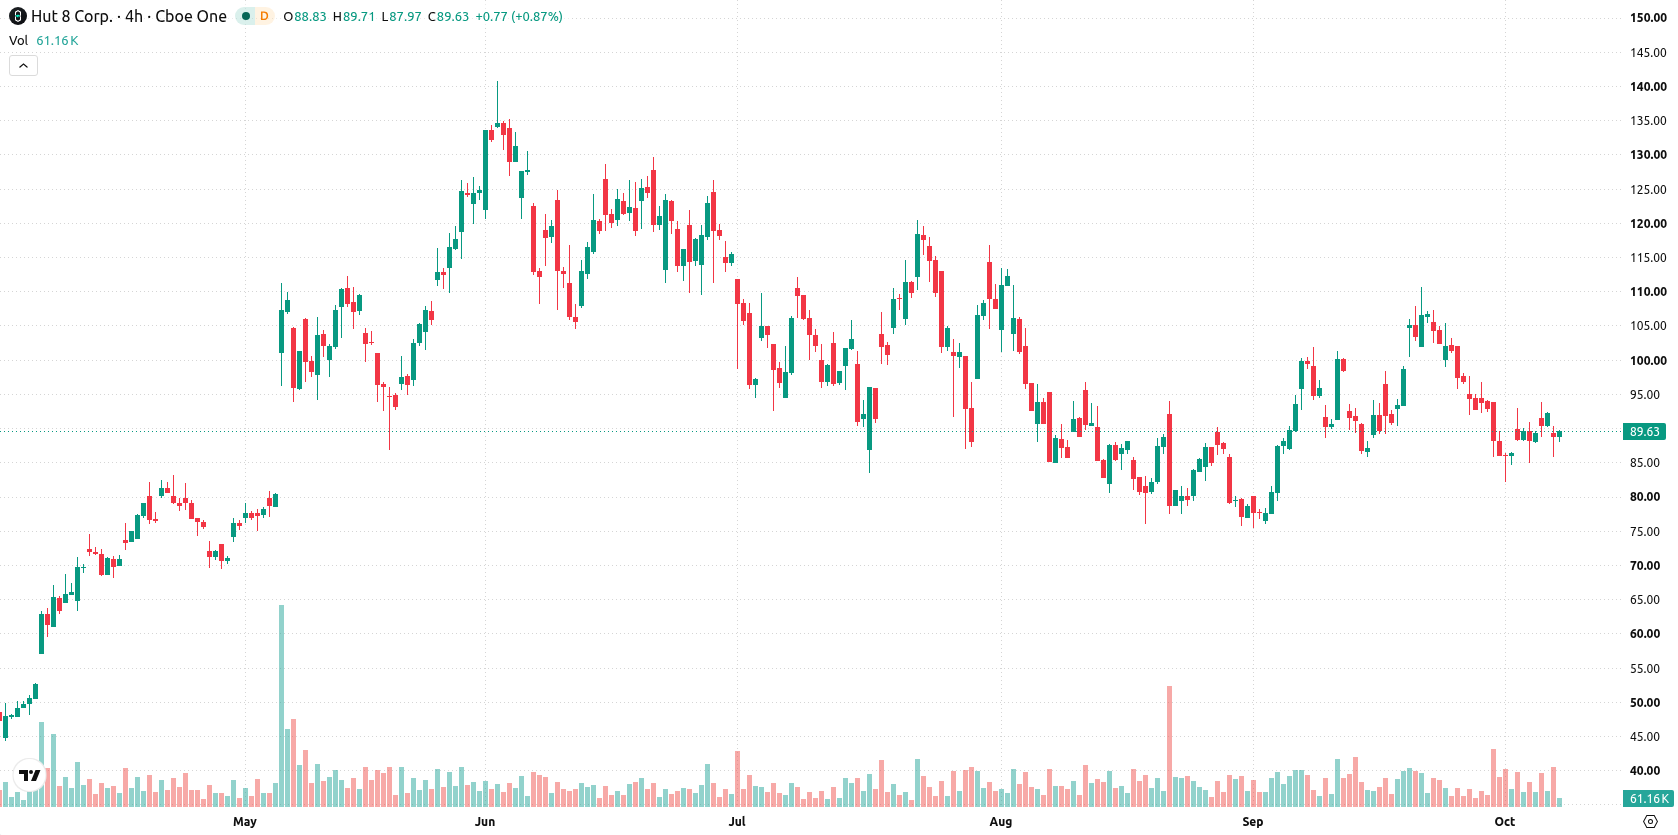
Mixed signals as intraday rebound tests weak momentum and resistance
Hut 8 is currently trading below its 20-day and 50-day moving averages at $94.16 and $91.23, respectively, but remains above the long-term 200-day moving average at $80.77. This setup suggests short- and medium-term selling pressure, even as the bullish alignment of the 50-day versus the 200-day average confirms a supportive long-term trend structure. Key intraday levels to watch are resistance at the near-term ceiling of $90.1 and support at the near-term floor of $85.82. Momentum indicators present mixed signals. The Moving Average Convergence Divergence (MACD) and Average Directional Index (ADX) indicate neutrality, pointing to limited underlying trend strength. The Relative Strength Index (RSI) at 49.71 issues a sell forecast but sits around the midpoint, suggesting a lack of broad overbought or oversold signals. Stochastic RSI and the Commodity Channel Index (CCI) are also neutral, with CCI not reaching extreme levels. Bull/Bear Power (BBP) signals buyers maintain intraday dominance, yet its overbought forecast highlights growing caution. The Awesome Oscillator remains neutral, not providing support to the current move. The stock opened with a downside gap of about 3.15%, lost $2.72 or 2.95%, and is now trading near today’s high with daily volatility at 4.99%. This reflects initial pressure after the open, followed by a rebound attempting to regain higher levels, set against a backdrop of wavering momentum signals.
Earlier, analysts noted that Hut 8 was facing a cautious technical outlook as mixed signals and persistent downside pressure elevated the risk of further declines. The latest developments reinforce this perspective, making price action around the $85.82 support level especially pivotal for traders monitoring near-term downside risk.











-
 Afghanistan
-
 Albania
-
 Algeria
-
 Angola
-
 Argentina
-
 Armenia
-
 Australia
-
 Austria
-
 Azerbaijan
-
 Bahamas
-
 Bahrain
-
 Bangladesh
-
 Belarus
-
 Belgium
-
 Bolivia
-
 Botswana
-
 Brazil
-
 Brunei
-
 Bulgaria
-
 Cambodia
-
 Cameroon
-
 Canada
-
 Chile
-
 China
-
 Colombia
-
 Congo
-
 Costa Rica
-
 Cote d'Ivoire
-
 Croatia
-
 Cuba
-
 Cyprus
-
 Czechia
-
 DR Congo
-
 Denmark
-
 Dominican Republic
-
 Ecuador
-
 Egypt
-
 El Salvador
-
 Estonia
-
 Eswatini
-
 Ethiopia
-
 Finland
-
 France
-
 Georgia
-
 Germany
-
 Ghana
-
 Greece
-
 Haiti
-
 Hong Kong
-
 Hungary
-
 India
-
 Indonesia
-
 Iran, Islamic republic
-
 Iraq
-
 Ireland
-
 Israel
-
 Italy
-
 Jamaica
-
 Japan
-
 Jordan
-
 Kazakhstan
-
 Kenya
-
 Korea
-
 Kuwait
-
 Kyrgyzstan
-
 Laos
-
 Latvia
-
 Lebanon
-
 Lesotho
-
 Libya
-
 Lithuania
-
 Luxembourg
-
 Madagascar
-
 Malaysia
-
 Malta
-
 Mauritius
-
 Mexico
-
 Moldova
-
 Mongolia
-
 Montenegro
-
 Morocco
-
 Mozambique
-
 Myanmar
-
 Namibia
-
 Nepal
-
 Netherlands
-
 New Zealand
-
 Nigeria
-
 North Macedonia
-
 Norway
-
 Oman
-
 Pakistan
-
 Palestine
-
 Panama
-
 Papua New Guinea
-
 Paraguay
-
 Peru
-
 Philippines
-
 Poland
-
 Portugal
-
 Puerto Rico
-
 Qatar
-
 Reunion
-
 Romania
-
 Rwanda
-
 Saudi Arabia
-
 Serbia
-
 Singapore
-
 Slovakia
-
 Slovenia
-
 Somalia
-
 South Africa
-
 Spain
-
 Sri Lanka
-
 Sweden
-
 Switzerland
-
 Syria
-
 Taiwan
-
 Tajikistan
-
 Tanzania
-
 Thailand
-
 Trinidad and Tobago
-
 Tunisia
-
 Turkey
-
 UAE
-
 Uganda
-
 Ukraine
-
 United Kingdom
-
United States
-
 Uruguay
-
 Uzbekistan
-
 Venezuela
-
 Vietnam
-
 Yemen
-
 Zambia
-
 Zimbabwe
- Forex
- Crypto












