

Arm shares technical analysis: Support test at $280.71 amid weak momentum

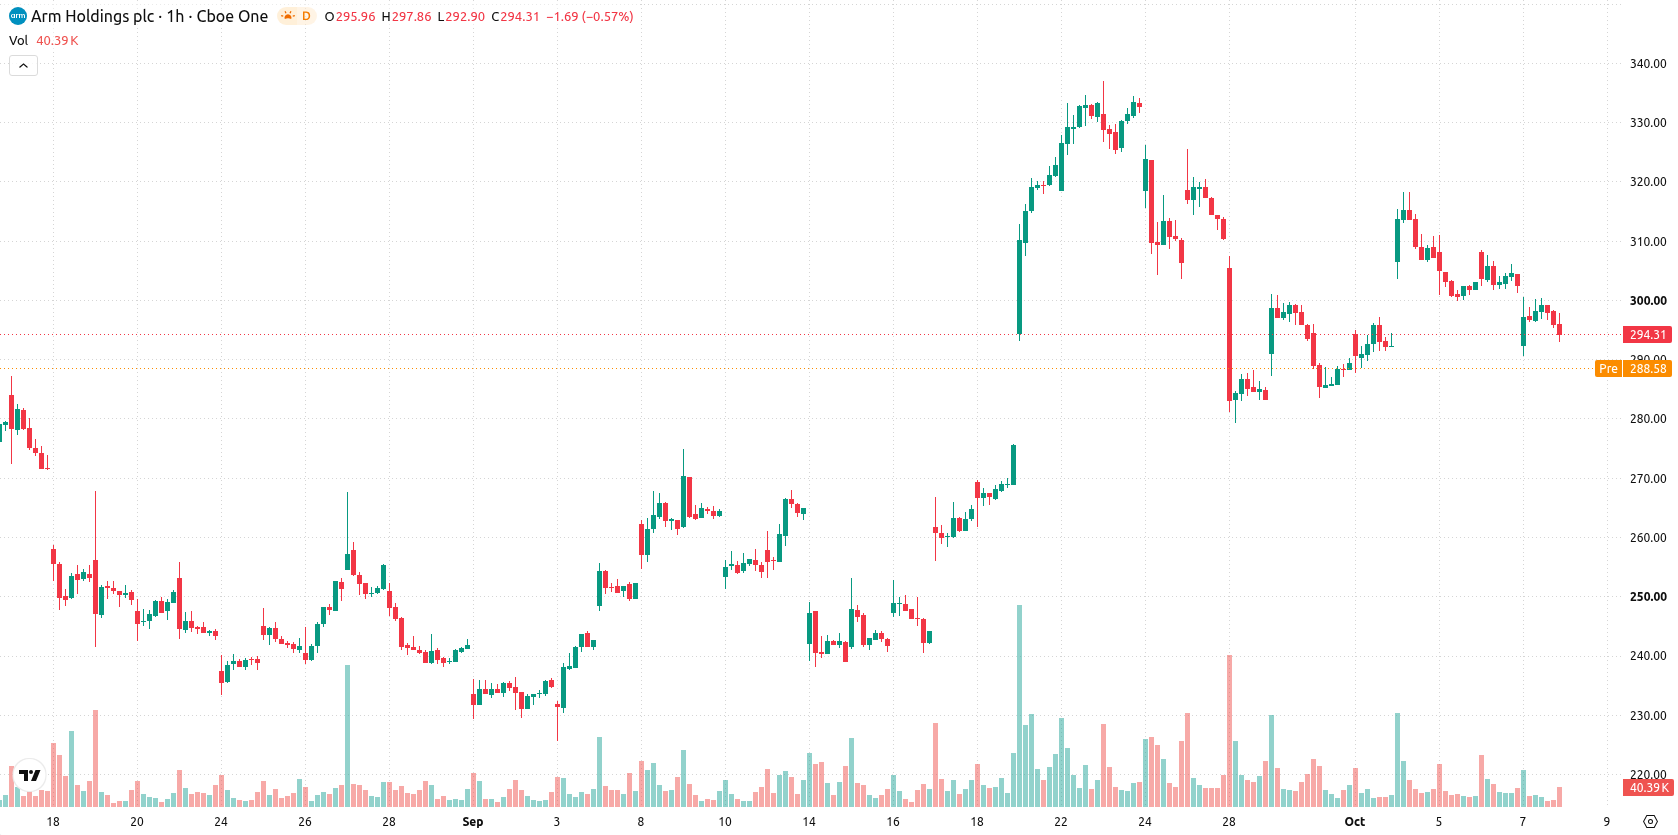
Arm (ARM) stock is trading at $294.37 after falling 2.71% on the day. The price remains below its short- and medium-term moving averages while still holding above its long-term moving average.
 181.55
207.31
Highlights
- Microsoft is testing agentic AI features for Surface laptops, evaluating whether Arm chips can support advanced AI workloads.
- This move introduces uncertainty around Arm's ability to scale from mobile to premium AI hardware in next-generation devices.
- Shares of Arm trade below key moving averages with bearish momentum, projected to range between $280.71 and $308.03 in the short term.
AI ambitions spur uncertainty as Arm faces scalability questions
Microsoft is preparing to launch agentic AI features for its Surface laptops, with initial testing focused on evaluating whether Arm architecture can transition from efficient mobile-focused chips to powering premium AI computing, according to Gurufocus. This development introduces uncertainty about Arm’s competitiveness in meeting demanding AI workloads, influencing sentiment as the market questions the scalability and attractiveness of Arm’s architecture for next-generation devices. The announcement has drawn significant attention to Arm’s strategic positioning in the evolving AI hardware landscape.
Downside exhaustion as momentum indicators signal persistent selling
On the technical side, ARM is trading below its MA-20 at $300.84 and MA-50 at $298.39, but remains above the MA-200 at $218.55. The Ichimoku Kijun sits at $304.46, acting as immediate resistance for any short-term rebound attempts. Among momentum indicators, MACD signals Sell, ADX shows a neutral trend strength, and RSI registers at 38.38, while Stochastic RSI, CCI, and Bull/Bear Power highlight pronounced oversold and seller-dominated conditions. This cluster of indicators points to downside exhaustion yet offers no clear indication of a reversal at present, with the current price trading in the mid-range of the session amid high volatility and a significant gap down from the prior close.
Sideways bias set as direction hinges on breakout or breakdown
Over the next 2-3 trading days, ARM is expected to move within a volatility band of $280.71 to $308.03. There is a 25% probability of an upward move, while the chance of further declines is assessed at 75%. The base scenario anticipates the price moving sideways within the defined range; a bullish breakout requires a clear move above the $304.46 resistance level, while renewed downside risk is confirmed on a drop below $280.71.
Previously it was reported that Arm Holdings was exhibiting mixed technical signals with a rangebound outlook as buyers and sellers maintained a narrow balance. The current analysis adds a new dimension by highlighting increased downside risk amid persistent selling pressure and questions around Arm's AI scalability, making the $304.46 resistance a key level for any potential short-term recovery.











-
 Afghanistan
-
 Albania
-
 Algeria
-
 Angola
-
 Argentina
-
 Armenia
-
 Australia
-
 Austria
-
 Azerbaijan
-
 Bahamas
-
 Bahrain
-
 Bangladesh
-
 Belarus
-
 Belgium
-
 Bolivia
-
 Botswana
-
 Brazil
-
 Brunei
-
 Bulgaria
-
 Cambodia
-
 Cameroon
-
 Canada
-
 Chile
-
 China
-
 Colombia
-
 Congo
-
 Costa Rica
-
 Cote d'Ivoire
-
 Croatia
-
 Cuba
-
 Cyprus
-
 Czechia
-
 DR Congo
-
 Denmark
-
 Dominican Republic
-
 Ecuador
-
 Egypt
-
 El Salvador
-
 Estonia
-
 Eswatini
-
 Ethiopia
-
 Finland
-
 France
-
 Georgia
-
 Germany
-
 Ghana
-
 Greece
-
 Haiti
-
 Hong Kong
-
 Hungary
-
 India
-
 Indonesia
-
 Iran, Islamic republic
-
 Iraq
-
 Ireland
-
 Israel
-
 Italy
-
 Jamaica
-
 Japan
-
 Jordan
-
 Kazakhstan
-
 Kenya
-
 Korea
-
 Kuwait
-
 Kyrgyzstan
-
 Laos
-
 Latvia
-
 Lebanon
-
 Lesotho
-
 Libya
-
 Lithuania
-
 Luxembourg
-
 Madagascar
-
 Malaysia
-
 Malta
-
 Mauritius
-
 Mexico
-
 Moldova
-
 Mongolia
-
 Montenegro
-
 Morocco
-
 Mozambique
-
 Myanmar
-
 Namibia
-
 Nepal
-
 Netherlands
-
 New Zealand
-
 Nigeria
-
 North Macedonia
-
 Norway
-
 Oman
-
 Pakistan
-
 Palestine
-
 Panama
-
 Papua New Guinea
-
 Paraguay
-
 Peru
-
 Philippines
-
 Poland
-
 Portugal
-
 Puerto Rico
-
 Qatar
-
 Reunion
-
 Romania
-
 Rwanda
-
 Saudi Arabia
-
 Serbia
-
 Singapore
-
 Slovakia
-
 Slovenia
-
 Somalia
-
 South Africa
-
 Spain
-
 Sri Lanka
-
 Sweden
-
 Switzerland
-
 Syria
-
 Taiwan
-
 Tajikistan
-
 Tanzania
-
 Thailand
-
 Trinidad and Tobago
-
 Tunisia
-
 Turkey
-
 UAE
-
 Uganda
-
 Ukraine
-
 United Kingdom
-
United States
-
 Uruguay
-
 Uzbekistan
-
 Venezuela
-
 Vietnam
-
 Yemen
-
 Zambia
-
 Zimbabwe
- Forex
- Crypto












