

National Grid stock trades near GBX1,166 resistance as short-term rally fades

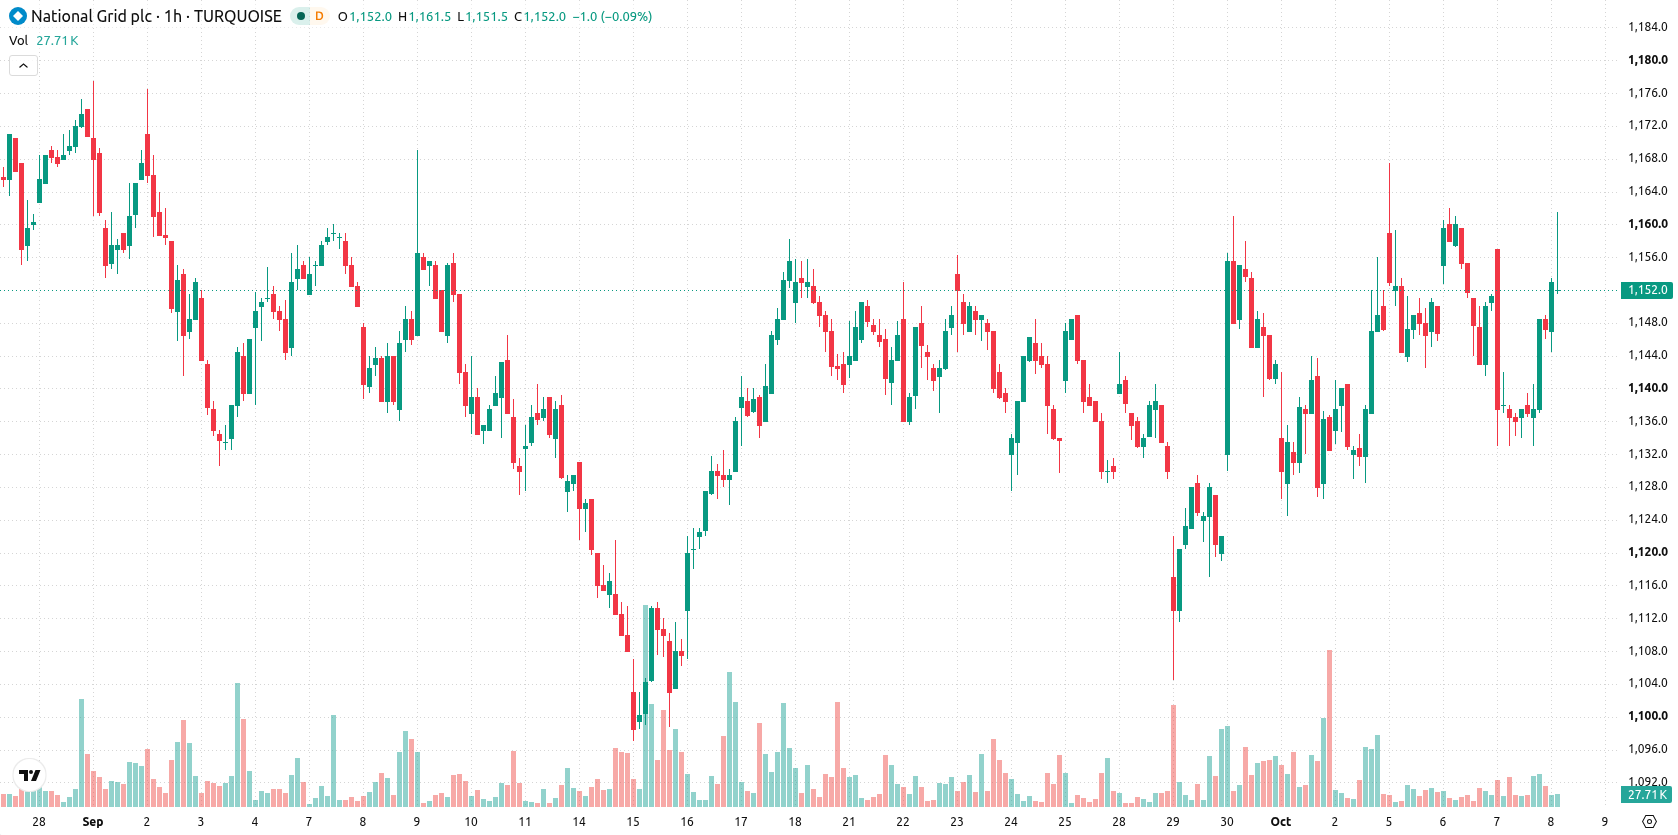
National Grid (NG) stock is trading at GBX1,150, reflecting a neutral daily move. The price sits above its short- and medium-term moving averages but remains capped beneath the longer-term trend indicator.
 1284.50
Highlights
- Shares trade above short- and medium-term moving averages but remain below long-term trend levels, indicating mixed directional signals.
- Momentum indicators show strong intraday buyer dominance, but other signals such as MACD and ADX do not confirm a clear sustained trend.
- Forecast anticipates consolidation between GBX1,133 and GBX1,166, with a 72% probability of an upward move if resistance breaks.
Mixed momentum as short-term signals conflict with trend
On the H1 timeframe, NG trades above the MA-20 and MA-50, but remains below the MA-200 on the daily chart. The Ichimoku Kijun sits at GBX1,147, offering a nearby support level. MACD issues a strong sell signal, ADX is neutral, and RSI prints a neutral 51.84 with a buy bias. Both Stoch RSI and CCI are flat, AO is neutral, while Bull/Bear Power indicates an overbought intraday condition. This combination highlights a mixed technical picture, with no clear alignment between short-term momentum and longer-term trend indicators.
Volatility band defined as breakout risks shape outlook
In the short term, NG is likely to consolidate within the GBX1,133–GBX1,166 corridor. There is a 72% probability of an upward move, while a drop to the lower boundary is less likely at 28%. A bullish breakout emerges if the price clears GBX1,166, while a sustained move below GBX1,133 would signal renewed downside risk. This range defines the current volatility band relative to recent levels.
Earlier, analysts noted that National Grid shares were under persistent downward pressure and were expected to remain rangebound amid mixed technical signals. The current setup adds a new dimension as short-term momentum indicators turn neutral and overbought conditions appear intraday, making GBX1,166 the key breakout level to monitor for any shift in direction.











-
 Afghanistan
-
 Albania
-
 Algeria
-
 Angola
-
 Argentina
-
 Armenia
-
 Australia
-
 Austria
-
 Azerbaijan
-
 Bahamas
-
 Bahrain
-
 Bangladesh
-
 Belarus
-
 Belgium
-
 Bolivia
-
 Botswana
-
 Brazil
-
 Brunei
-
 Bulgaria
-
 Cambodia
-
 Cameroon
-
 Canada
-
 Chile
-
 China
-
 Colombia
-
 Congo
-
 Costa Rica
-
 Cote d'Ivoire
-
 Croatia
-
 Cuba
-
 Cyprus
-
 Czechia
-
 DR Congo
-
 Denmark
-
 Dominican Republic
-
 Ecuador
-
 Egypt
-
 El Salvador
-
 Estonia
-
 Eswatini
-
 Ethiopia
-
 Finland
-
 France
-
 Georgia
-
 Germany
-
 Ghana
-
 Greece
-
 Haiti
-
 Hong Kong
-
 Hungary
-
 India
-
 Indonesia
-
 Iran, Islamic republic
-
 Iraq
-
 Ireland
-
 Israel
-
 Italy
-
 Jamaica
-
 Japan
-
 Jordan
-
 Kazakhstan
-
 Kenya
-
 Korea
-
 Kuwait
-
 Kyrgyzstan
-
 Laos
-
 Latvia
-
 Lebanon
-
 Lesotho
-
 Libya
-
 Lithuania
-
 Luxembourg
-
 Madagascar
-
 Malaysia
-
 Malta
-
 Mauritius
-
 Mexico
-
 Moldova
-
 Mongolia
-
 Montenegro
-
 Morocco
-
 Mozambique
-
 Myanmar
-
 Namibia
-
 Nepal
-
 Netherlands
-
 New Zealand
-
 Nigeria
-
 North Macedonia
-
 Norway
-
 Oman
-
 Pakistan
-
 Palestine
-
 Panama
-
 Papua New Guinea
-
 Paraguay
-
 Peru
-
 Philippines
-
 Poland
-
 Portugal
-
 Puerto Rico
-
 Qatar
-
 Reunion
-
 Romania
-
 Rwanda
-
 Saudi Arabia
-
 Serbia
-
 Singapore
-
 Slovakia
-
 Slovenia
-
 Somalia
-
 South Africa
-
 Spain
-
 Sri Lanka
-
 Sweden
-
 Switzerland
-
 Syria
-
 Taiwan
-
 Tajikistan
-
 Tanzania
-
 Thailand
-
 Trinidad and Tobago
-
 Tunisia
-
 Turkey
-
 UAE
-
 Uganda
-
 Ukraine
-
 United Kingdom
-
United States
-
 Uruguay
-
 Uzbekistan
-
 Venezuela
-
 Vietnam
-
 Yemen
-
 Zambia
-
 Zimbabwe
- Forex
- Crypto












