

Amazon stock weekly forecast: Recovery holds but faces a stretched setup

Shares of Amazon.com, Inc. (AMZN) are trading near $259 after a recovery of almost 3% over the week, with the advance held in place by rising interest in the company’s AI and cloud initiatives. The recent move leaves the setup extended, but with support holding, traders are preparing for a week that could test the upper end of the current range.
 241.48
255.18
Highlights
- Shares of Amazon rose 2.87% over the past week, trading at $258.6 and holding the 50-day average.
- Price action remains within a narrow range at the top of the weekly band, with volatility at 4.03%.
- Technicals show a bullish structure despite mixed short-term momentum, with consolidation likely from $254.09 to $263.1 and 71% probability of an increase.
Restructuring initiatives and aws pricing move shape sentiment during the week
Amazon confirmed a new round of layoffs on October 8, 2026, affecting fewer than 1,000 employees in its U.S. retail operations as part of a broader restructuring to realign its Stores department, according to GuruFocus. The week ahead is also shaped by AWS raising prices for Nvidia-based EC2 reserved GPU rentals by approximately 15% effective October 7, driving focus on cloud unit profitability and customer reaction. In addition, Amazon signed a multi-year deal valued at over $1 billion with Synopsys to support its custom chip strategy and further reduce Nvidia reliance, as reported by MarketBeat.
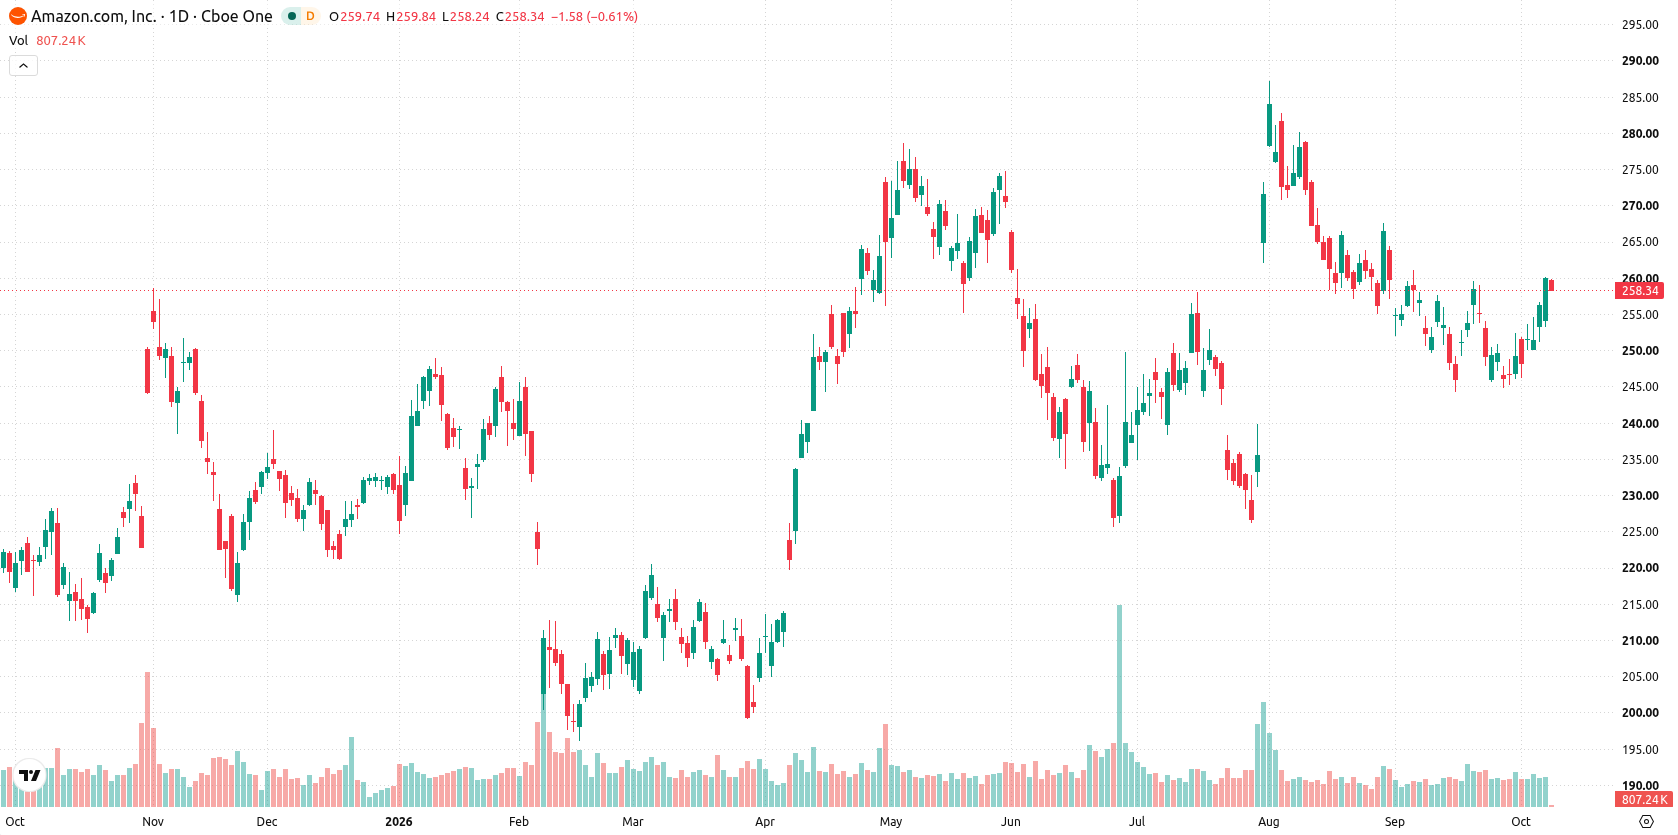
Range narrows at resistance as overbought signals limit upside momentum
The daily chart shows the price holding at key moving average support while approaching resistance at $260.14, with recent action coming at the very top of the weekly range as volatility reached 4.03%. Momentum signals are mixed, as Bull/Bear Power shows an overbought condition and the Stochastic RSI sits in an overbought zone at 100, yet the RSI remains neutral at 58.03. The Ichimoku Kijun at $252.21 provides a practical support reference. Overall, price action is marked by a contained move within a narrow range, suggesting no dominant trend but clear upward pressure.
Consolidation likely as breakout risk centers on key resistance next week
Over the coming trading week, the expected range is $254.09 to $263.1. The probability of an increase is 71%, with a 29% chance of a decrease. The base case is continued consolidation between $258.02 and $260.14. A close above $260.14 would open further upside, while sustained weakness below $258.02 would turn attention toward stronger support at the Ichimoku Kijun at $252.21.
Previously it was reported that insider selling among AI-linked technology billionaires, including Amazon founder Jeff Bezos, reflected sector-wide caution amid valuation and regulatory concerns. The latest developments around Amazon's restructuring and its strategic push to reduce Nvidia reliance add a new dimension to the narrative, making the $260.14 resistance level a key area to watch for a potential breakout in the near term.











-
 Afghanistan
-
 Albania
-
 Algeria
-
 Angola
-
 Argentina
-
 Armenia
-
 Australia
-
 Austria
-
 Azerbaijan
-
 Bahamas
-
 Bahrain
-
 Bangladesh
-
 Belarus
-
 Belgium
-
 Bolivia
-
 Botswana
-
 Brazil
-
 Brunei
-
 Bulgaria
-
 Cambodia
-
 Cameroon
-
 Canada
-
 Chile
-
 China
-
 Colombia
-
 Congo
-
 Costa Rica
-
 Cote d'Ivoire
-
 Croatia
-
 Cuba
-
 Cyprus
-
 Czechia
-
 DR Congo
-
 Denmark
-
 Dominican Republic
-
 Ecuador
-
 Egypt
-
 El Salvador
-
 Estonia
-
 Eswatini
-
 Ethiopia
-
 Finland
-
 France
-
 Georgia
-
 Germany
-
 Ghana
-
 Greece
-
 Haiti
-
 Hong Kong
-
 Hungary
-
 India
-
 Indonesia
-
 Iran, Islamic republic
-
 Iraq
-
 Ireland
-
 Israel
-
 Italy
-
 Jamaica
-
 Japan
-
 Jordan
-
 Kazakhstan
-
 Kenya
-
 Korea
-
 Kuwait
-
 Kyrgyzstan
-
 Laos
-
 Latvia
-
 Lebanon
-
 Lesotho
-
 Libya
-
 Lithuania
-
 Luxembourg
-
 Madagascar
-
 Malaysia
-
 Malta
-
 Mauritius
-
 Mexico
-
 Moldova
-
 Mongolia
-
 Montenegro
-
 Morocco
-
 Mozambique
-
 Myanmar
-
 Namibia
-
 Nepal
-
 Netherlands
-
 New Zealand
-
 Nigeria
-
 North Macedonia
-
 Norway
-
 Oman
-
 Pakistan
-
 Palestine
-
 Panama
-
 Papua New Guinea
-
 Paraguay
-
 Peru
-
 Philippines
-
 Poland
-
 Portugal
-
 Puerto Rico
-
 Qatar
-
 Reunion
-
 Romania
-
 Rwanda
-
 Saudi Arabia
-
 Serbia
-
 Singapore
-
 Slovakia
-
 Slovenia
-
 Somalia
-
 South Africa
-
 Spain
-
 Sri Lanka
-
 Sweden
-
 Switzerland
-
 Syria
-
 Taiwan
-
 Tajikistan
-
 Tanzania
-
 Thailand
-
 Trinidad and Tobago
-
 Tunisia
-
 Turkey
-
 UAE
-
 Uganda
-
 Ukraine
-
 United Kingdom
-
United States
-
 Uruguay
-
 Uzbekistan
-
 Venezuela
-
 Vietnam
-
 Yemen
-
 Zambia
-
 Zimbabwe
- Forex
- Crypto












