

Walmart stock faces resistance at the 200-day average after recent gains: weekly analysis

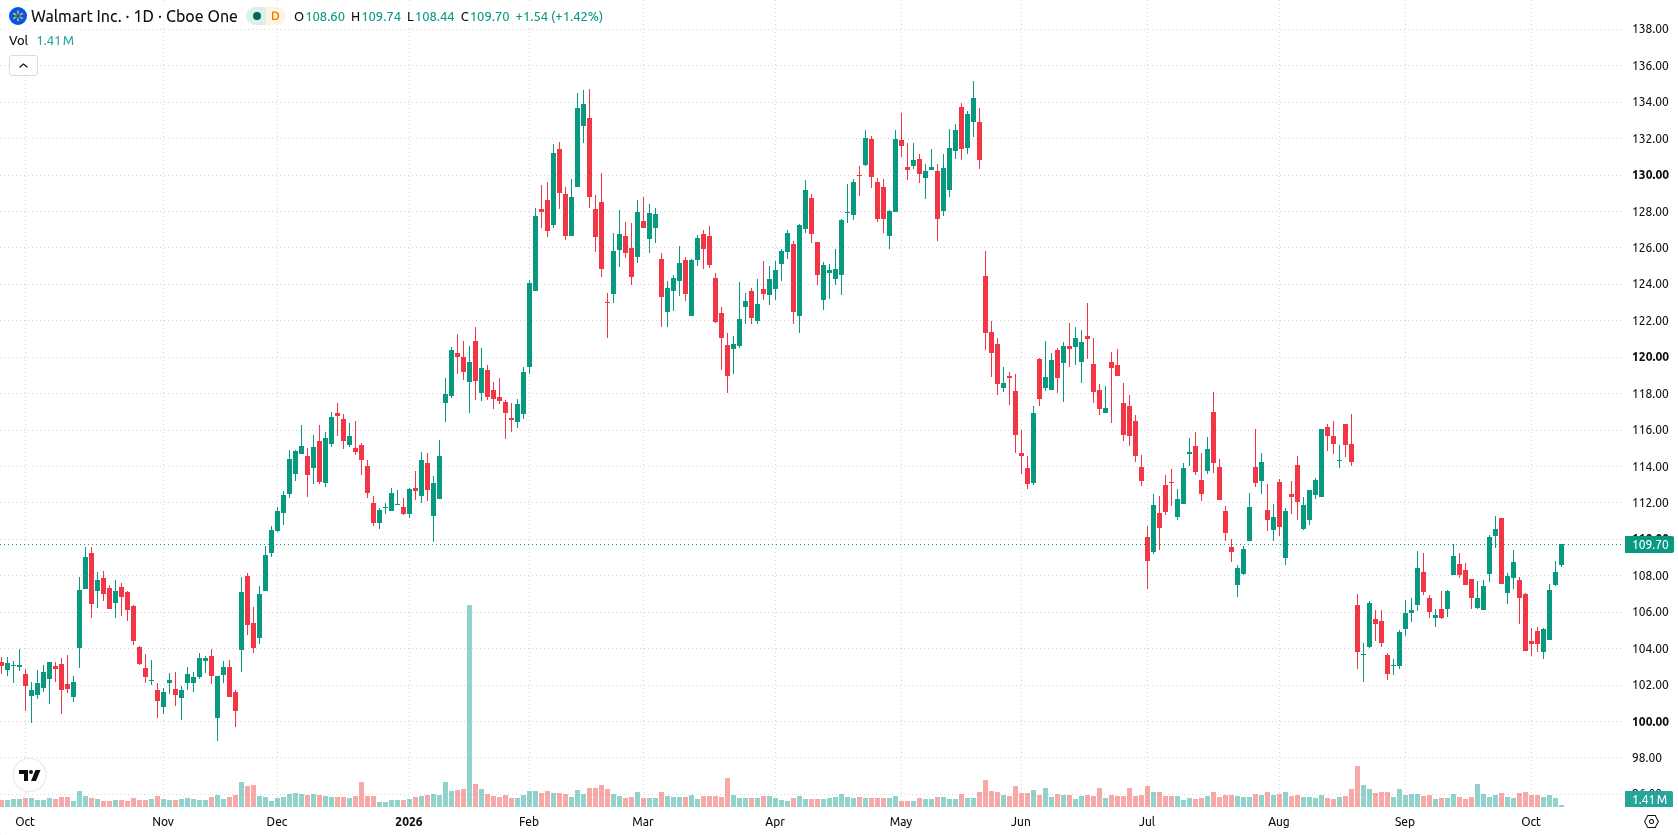
Shares of Walmart Inc. (WMT) are trading near $110 after climbing about 5% in the past week, as a recent rally runs into technical overbought conditions. Momentum signals on the daily chart are sending mixed messages, with short-term buyers pushing the stock higher even as longer-term signals diverge, setting up a potential battle between bulls and bears in the days ahead.
 124.27
Highlights
- Shares of Walmart rose 5.04% over the past week to $109.56, moving above short-term averages but remaining below the 200-day average.
- Technical indicators are mixed, with overbought short-term signals contrasting with a bearish long-term structure and contained volatility of 5.17%.
- The stock is expected to consolidate between $108.8 and $111.95, with resistance at $118.19 and support near $106.22 in the week ahead.
Digital transformation accelerates as drone expansion and ad growth drive sentiment
Walmart expanded its drone delivery partnership with Wing, targeting launches in the Denver and Seattle areas by 2027, according to GuruFocus and TipRanks, a move that continues its push into rapid delivery services following rollouts in Dallas-Fort Worth, Atlanta, Houston, and Orlando. In addition, Walmart Connect reported robust 43% ad segment revenue growth in the U.S. for the second quarter of fiscal 2027, based on data from Yahoo Finance, as the retailer leverages shopper data for new advertising partnerships with Warner Bros. Discovery, Spotify, and Yahoo. The company's ongoing investments in retail technologies, such as digital shelf labels and enhanced fulfillment infrastructure, further underline its focus on digital transformation this week.
Short-term buying strength emerges as mixed technicals limit breakout scope
On the daily chart, Walmart trades at the very top of its weekly range, while momentum signals are mixed. MACD remains in a strong sell configuration at -0.64, but HMA has turned bullish, and Bull/Bear Power registers an overbought reading, highlighting short-term buying strength. Volatility for the past week stands at 5.17%, and the move is characterized as a contained move within a narrow range. Immediate support is identified at $108.8, with resistance at the 200-day average of $118.19; the Ichimoku Kijun at $107.3 offers additional nearby support.
Consolidation favored this week as breakout levels define directional risk
In the week ahead, the expected range is $106.22 to $111.95, with a 47% probability of an increase and a 53% probability of a decrease. The most likely scenario is continued consolidation between $108.8 and $111.95. A close above $118.19 would shift bias bullishly for further gains, while a sustained move below $108.8 would signal renewed downside towards $106.22.
Previously, analysts noted that Walmart's dominant market position and ongoing investments in technology and operational efficiency underpin its financial resilience amid industry challenges. The latest trading signals suggest a heightened risk of volatility near key technical levels, making a sustained breakout above $118.19 or a reversal below $108.8 critical markers for traders to monitor closely.










-
 Afghanistan
-
 Albania
-
 Algeria
-
 Angola
-
 Argentina
-
 Armenia
-
 Australia
-
 Austria
-
 Azerbaijan
-
 Bahamas
-
 Bahrain
-
 Bangladesh
-
 Belarus
-
 Belgium
-
 Bolivia
-
 Botswana
-
 Brazil
-
 Brunei
-
 Bulgaria
-
 Cambodia
-
 Cameroon
-
 Canada
-
 Chile
-
 China
-
 Colombia
-
 Congo
-
 Costa Rica
-
 Cote d'Ivoire
-
 Croatia
-
 Cuba
-
 Cyprus
-
 Czechia
-
 DR Congo
-
 Denmark
-
 Dominican Republic
-
 Ecuador
-
 Egypt
-
 El Salvador
-
 Estonia
-
 Eswatini
-
 Ethiopia
-
 Finland
-
 France
-
 Georgia
-
 Germany
-
 Ghana
-
 Greece
-
 Haiti
-
 Hong Kong
-
 Hungary
-
 India
-
 Indonesia
-
 Iran, Islamic republic
-
 Iraq
-
 Ireland
-
 Israel
-
 Italy
-
 Jamaica
-
 Japan
-
 Jordan
-
 Kazakhstan
-
 Kenya
-
 Korea
-
 Kuwait
-
 Kyrgyzstan
-
 Laos
-
 Latvia
-
 Lebanon
-
 Lesotho
-
 Libya
-
 Lithuania
-
 Luxembourg
-
 Madagascar
-
 Malaysia
-
 Malta
-
 Mauritius
-
 Mexico
-
 Moldova
-
 Mongolia
-
 Montenegro
-
 Morocco
-
 Mozambique
-
 Myanmar
-
 Namibia
-
 Nepal
-
 Netherlands
-
 New Zealand
-
 Nigeria
-
 North Macedonia
-
 Norway
-
 Oman
-
 Pakistan
-
 Palestine
-
 Panama
-
 Papua New Guinea
-
 Paraguay
-
 Peru
-
 Philippines
-
 Poland
-
 Portugal
-
 Puerto Rico
-
 Qatar
-
 Reunion
-
 Romania
-
 Rwanda
-
 Saudi Arabia
-
 Serbia
-
 Singapore
-
 Slovakia
-
 Slovenia
-
 Somalia
-
 South Africa
-
 Spain
-
 Sri Lanka
-
 Sweden
-
 Switzerland
-
 Syria
-
 Taiwan
-
 Tajikistan
-
 Tanzania
-
 Thailand
-
 Trinidad and Tobago
-
 Tunisia
-
 Turkey
-
 UAE
-
 Uganda
-
 Ukraine
-
 United Kingdom
-
United States
-
 Uruguay
-
 Uzbekistan
-
 Venezuela
-
 Vietnam
-
 Yemen
-
 Zambia
-
 Zimbabwe
- Forex
- Crypto












