

Eli Lilly stock faces weak momentum: Technical outlook

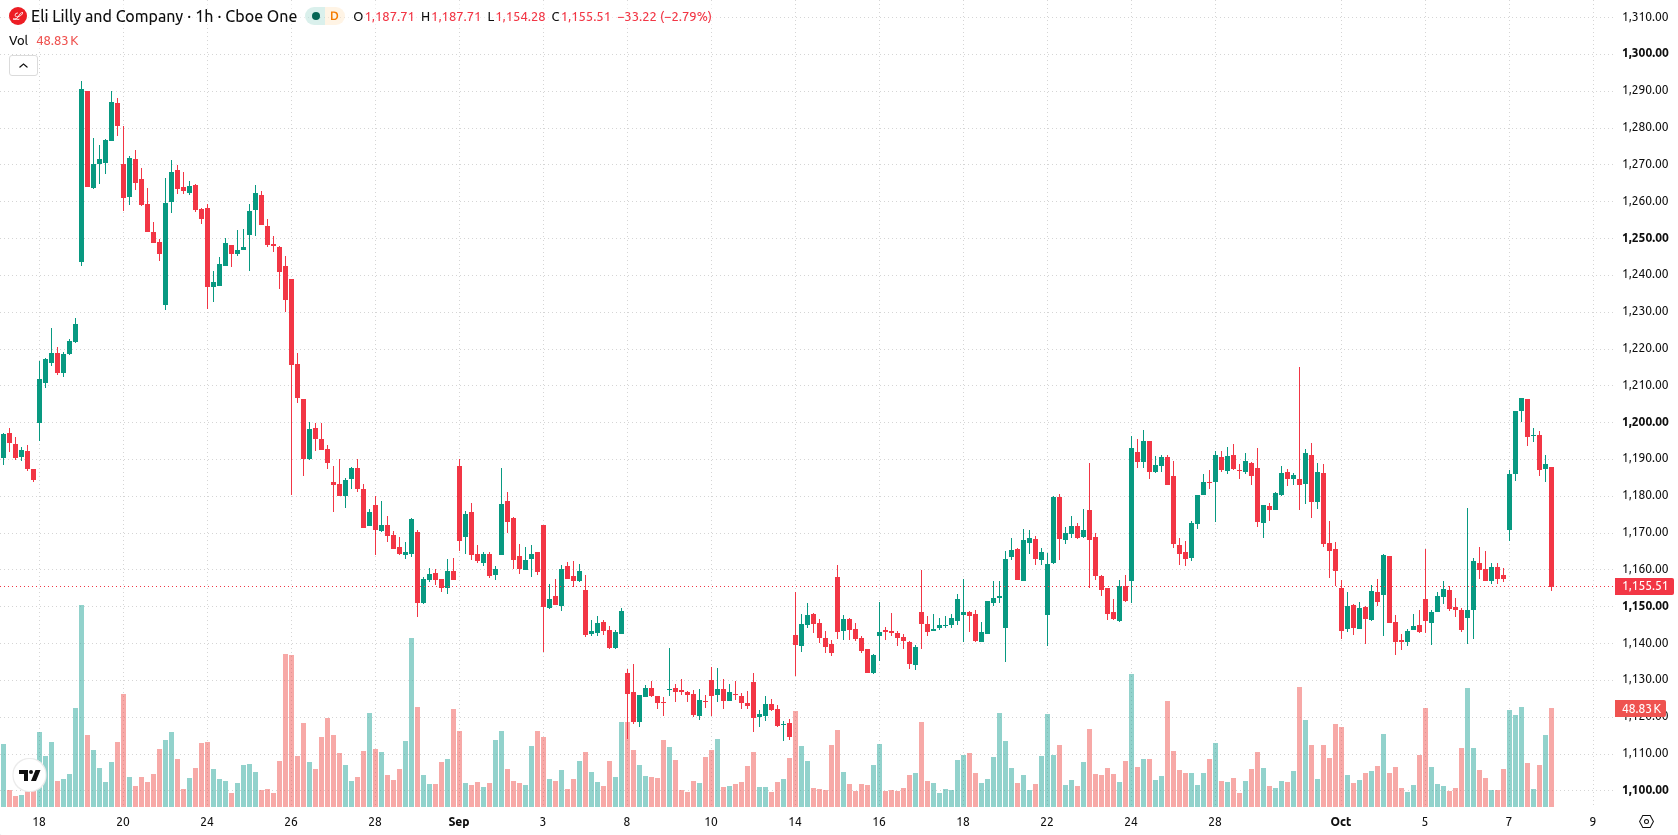
Eli Lilly (LLY) stock is trading at $1,152, down 3.03% on the day. The price has moved below its near-term moving averages but still holds above longer-term support.
 1437.00
Highlights
- Shares of Eli Lilly fell 3.03% today, closing near the session low during a period of high volatility.
- The stock trades below short- and medium-term moving averages but remains above long-term support, indicating mixed trend direction.
- Short-term forecast range is $1,121 to $1,202, with sideways movement likely and downside risk outweighing upside probability.
Buyer dominance amid mixed momentum and resistance at Kijun level
On the technical side, LLY is trading below the MA-20 ($1,168) and MA-50 ($1,164) on the hourly chart, with the MA-200 at $1,075 providing longer-term support. The nearest resistance is the Ichimoku Kijun level at $1,172, while immediate support is seen at $1,121. Momentum indicators present a mixed picture: MACD, ADX, and CCI signal buying momentum, with RSI at 60.83 and Bull/Bear Power in overbought territory, indicating buyer dominance. However, Stochastic RSI and Awesome Oscillator are neutral, and intraday price weakness stands in contrast to these bullish momentum signals, suggesting short-term uncertainty.
Sideways bias favored as breakout odds remain limited
In the next 2–3 trading days, LLY is expected to move within a typical volatility band between $1,121 and $1,202. There is a 33% probability of an upward break, while the base-case scenario anticipates sideways price action. A bullish scenario would see a breakout above the $1,172 resistance level and a test of higher ground, whereas a bearish outcome would be triggered by a fall below $1,121 support, leading to an extension of recent losses.
Earlier, analysts noted that Eli Lilly's stock demonstrated bullish momentum supported by strong earnings and technical strength above key averages. The current pullback below short-term moving averages introduces near-term uncertainty, with a decisive move above $1,172 or below $1,121 likely to signal the next directional trend.






Latest Eli Lilly and Company News



-
 Afghanistan
-
 Albania
-
 Algeria
-
 Angola
-
 Argentina
-
 Armenia
-
 Australia
-
 Austria
-
 Azerbaijan
-
 Bahamas
-
 Bahrain
-
 Bangladesh
-
 Belarus
-
 Belgium
-
 Bolivia
-
 Botswana
-
 Brazil
-
 Brunei
-
 Bulgaria
-
 Cambodia
-
 Cameroon
-
 Canada
-
 Chile
-
 China
-
 Colombia
-
 Congo
-
 Costa Rica
-
 Cote d'Ivoire
-
 Croatia
-
 Cuba
-
 Cyprus
-
 Czechia
-
 DR Congo
-
 Denmark
-
 Dominican Republic
-
 Ecuador
-
 Egypt
-
 El Salvador
-
 Estonia
-
 Eswatini
-
 Ethiopia
-
 Finland
-
 France
-
 Georgia
-
 Germany
-
 Ghana
-
 Greece
-
 Haiti
-
 Hong Kong
-
 Hungary
-
 India
-
 Indonesia
-
 Iran, Islamic republic
-
 Iraq
-
 Ireland
-
 Israel
-
 Italy
-
 Jamaica
-
 Japan
-
 Jordan
-
 Kazakhstan
-
 Kenya
-
 Korea
-
 Kuwait
-
 Kyrgyzstan
-
 Laos
-
 Latvia
-
 Lebanon
-
 Lesotho
-
 Libya
-
 Lithuania
-
 Luxembourg
-
 Madagascar
-
 Malaysia
-
 Malta
-
 Mauritius
-
 Mexico
-
 Moldova
-
 Mongolia
-
 Montenegro
-
 Morocco
-
 Mozambique
-
 Myanmar
-
 Namibia
-
 Nepal
-
 Netherlands
-
 New Zealand
-
 Nigeria
-
 North Macedonia
-
 Norway
-
 Oman
-
 Pakistan
-
 Palestine
-
 Panama
-
 Papua New Guinea
-
 Paraguay
-
 Peru
-
 Philippines
-
 Poland
-
 Portugal
-
 Puerto Rico
-
 Qatar
-
 Reunion
-
 Romania
-
 Rwanda
-
 Saudi Arabia
-
 Serbia
-
 Singapore
-
 Slovakia
-
 Slovenia
-
 Somalia
-
 South Africa
-
 Spain
-
 Sri Lanka
-
 Sweden
-
 Switzerland
-
 Syria
-
 Taiwan
-
 Tajikistan
-
 Tanzania
-
 Thailand
-
 Trinidad and Tobago
-
 Tunisia
-
 Turkey
-
 UAE
-
 Uganda
-
 Ukraine
-
 United Kingdom
-
United States
-
 Uruguay
-
 Uzbekistan
-
 Venezuela
-
 Vietnam
-
 Yemen
-
 Zambia
-
 Zimbabwe
- Forex
- Crypto












