

Johnson & Johnson stock remains below resistance with MACD signaling a sell: weekly analysis

Shares of Johnson & Johnson (JNJ) are trading near $253, extending their decline this week as the chart now signals oversold conditions and mounting short-term pressure. The setup reflects a contained but persistent loss of momentum, with mixed technical signals pointing to a potential stabilization near current levels in the days ahead.
 277.73
278.05
Highlights
- Shares of Johnson & Johnson closed at $253.24, falling 1.07% over the past seven days and remaining below short-term moving averages.
- Oscillators and momentum indicators currently show short-term bearish momentum and an oversold reading, while long-term trends remain intact.
- Price action is expected to consolidate within a $248.41 to $257.43 range, with immediate support at $251.28 and resistance at $260.66.
Dividend hike and year-over-year growth support sentiment despite patent risks
Johnson & Johnson demonstrated its commitment to shareholder returns by raising its quarterly dividend for the 64th consecutive year to $1.34 per share, according to 24/7 Wall St. The company also reported 6.6% year-over-year sales growth in the second quarter of 2026, even amid patent-related headwinds for STELARA, as highlighted by Seeking Alpha. An SEC filing further showed that Eastern Bank added 153,938 shares of JNJ to its portfolio as of September 30, 2026, according to Quiver Quantitative.
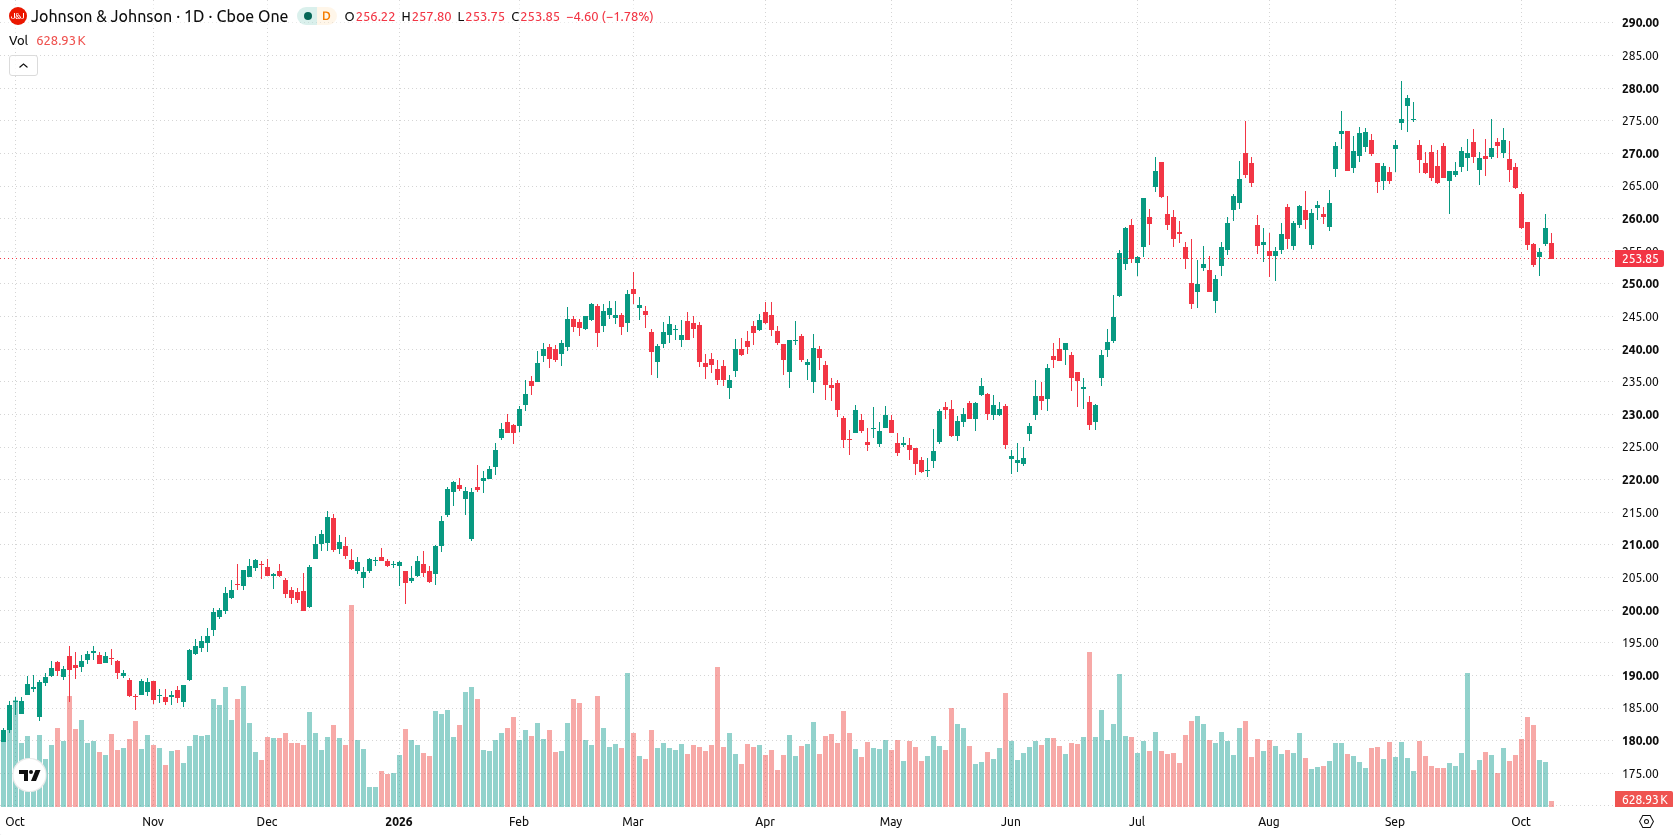
Narrow trading range persists as momentum shifts to short-term bearish
On the daily chart, Johnson & Johnson stock is displaying a flat trend with momentum reflecting a contained move within a narrow range as volatility touched 3.73% for the week. The MACD signals a Sell while the CCI reading of -105.23 places the stock in the oversold zone, highlighting short-term bearish momentum in contrast to a neutral RSI. Immediate support sits at $251.28, with resistance up at $260.66, while the Ichimoku Kijun at $265.07 acts as an added resistance barrier. This mix of oversold and neutral readings alongside contained momentum suggests the stock may remain under pressure but could stabilize above support.
Consolidation expected in the coming week unless key levels break
For the next five trading days, the expected range is $248.41 to $257.43. There is a 50% probability of an increase and a 50% probability of a decrease. The base case is continued consolidation inside this range. A sustained move above $260.66 would open a bullish scenario, while a drop below $251.28 would shift the bias further bearish.
Earlier, analysts noted that Johnson & Johnson shares were consolidating with mixed technical signals and uncertainty regarding the near-term direction. The current article confirms this ongoing consolidation bias, with prevailing downside risk centered on the $251.28 support level as traders await a decisive move outside the $248.41 to $257.43 range.











-
 Afghanistan
-
 Albania
-
 Algeria
-
 Angola
-
 Argentina
-
 Armenia
-
 Australia
-
 Austria
-
 Azerbaijan
-
 Bahamas
-
 Bahrain
-
 Bangladesh
-
 Belarus
-
 Belgium
-
 Bolivia
-
 Botswana
-
 Brazil
-
 Brunei
-
 Bulgaria
-
 Cambodia
-
 Cameroon
-
 Canada
-
 Chile
-
 China
-
 Colombia
-
 Congo
-
 Costa Rica
-
 Cote d'Ivoire
-
 Croatia
-
 Cuba
-
 Cyprus
-
 Czechia
-
 DR Congo
-
 Denmark
-
 Dominican Republic
-
 Ecuador
-
 Egypt
-
 El Salvador
-
 Estonia
-
 Eswatini
-
 Ethiopia
-
 Finland
-
 France
-
 Georgia
-
 Germany
-
 Ghana
-
 Greece
-
 Haiti
-
 Hong Kong
-
 Hungary
-
 India
-
 Indonesia
-
 Iran, Islamic republic
-
 Iraq
-
 Ireland
-
 Israel
-
 Italy
-
 Jamaica
-
 Japan
-
 Jordan
-
 Kazakhstan
-
 Kenya
-
 Korea
-
 Kuwait
-
 Kyrgyzstan
-
 Laos
-
 Latvia
-
 Lebanon
-
 Lesotho
-
 Libya
-
 Lithuania
-
 Luxembourg
-
 Madagascar
-
 Malaysia
-
 Malta
-
 Mauritius
-
 Mexico
-
 Moldova
-
 Mongolia
-
 Montenegro
-
 Morocco
-
 Mozambique
-
 Myanmar
-
 Namibia
-
 Nepal
-
 Netherlands
-
 New Zealand
-
 Nigeria
-
 North Macedonia
-
 Norway
-
 Oman
-
 Pakistan
-
 Palestine
-
 Panama
-
 Papua New Guinea
-
 Paraguay
-
 Peru
-
 Philippines
-
 Poland
-
 Portugal
-
 Puerto Rico
-
 Qatar
-
 Reunion
-
 Romania
-
 Rwanda
-
 Saudi Arabia
-
 Serbia
-
 Singapore
-
 Slovakia
-
 Slovenia
-
 Somalia
-
 South Africa
-
 Spain
-
 Sri Lanka
-
 Sweden
-
 Switzerland
-
 Syria
-
 Taiwan
-
 Tajikistan
-
 Tanzania
-
 Thailand
-
 Trinidad and Tobago
-
 Tunisia
-
 Turkey
-
 UAE
-
 Uganda
-
 Ukraine
-
 United Kingdom
-
United States
-
 Uruguay
-
 Uzbekistan
-
 Venezuela
-
 Vietnam
-
 Yemen
-
 Zambia
-
 Zimbabwe
- Forex
- Crypto












