

Verizon shares weekly forecast: Downside risks persist as price action stalls below $46 resistance

Shares of Verizon Communications Inc. (VZ) are trading near $46 with sellers keeping pressure as the setup remains deep in oversold territory. While the move over the week has been minor, lingering pressure signals downside risks persist into the coming days.
 45.16
45.16
Highlights
- Shares of Verizon closed at $45.87, showing near-term weakness and trading below all major daily moving averages.
- Momentum indicators approach oversold levels, and downside pressure persists with support at $45.3 and resistance at $46.49.
- For the next five sessions, shares are likely to remain between $45.3 and $46.43 with a high probability of a decrease.
Dividend streak and new partnerships bolster sentiment despite ongoing market pressure
Verizon confirmed the record date for its upcoming quarterly dividend, with shareholders of record this week set to receive the declared payment in early November, according to Kalkine Media. The company's 20-year streak of increasing dividends was highlighted by BigGo Finance, underscoring ongoing shareholder returns alongside strong free cash flow projections. Additional initiatives include a joint venture with AT&T and T-Mobile to extend wireless coverage in underserved areas, as well as a reseller partnership with SKYBOXE for Verizon Business data plans.
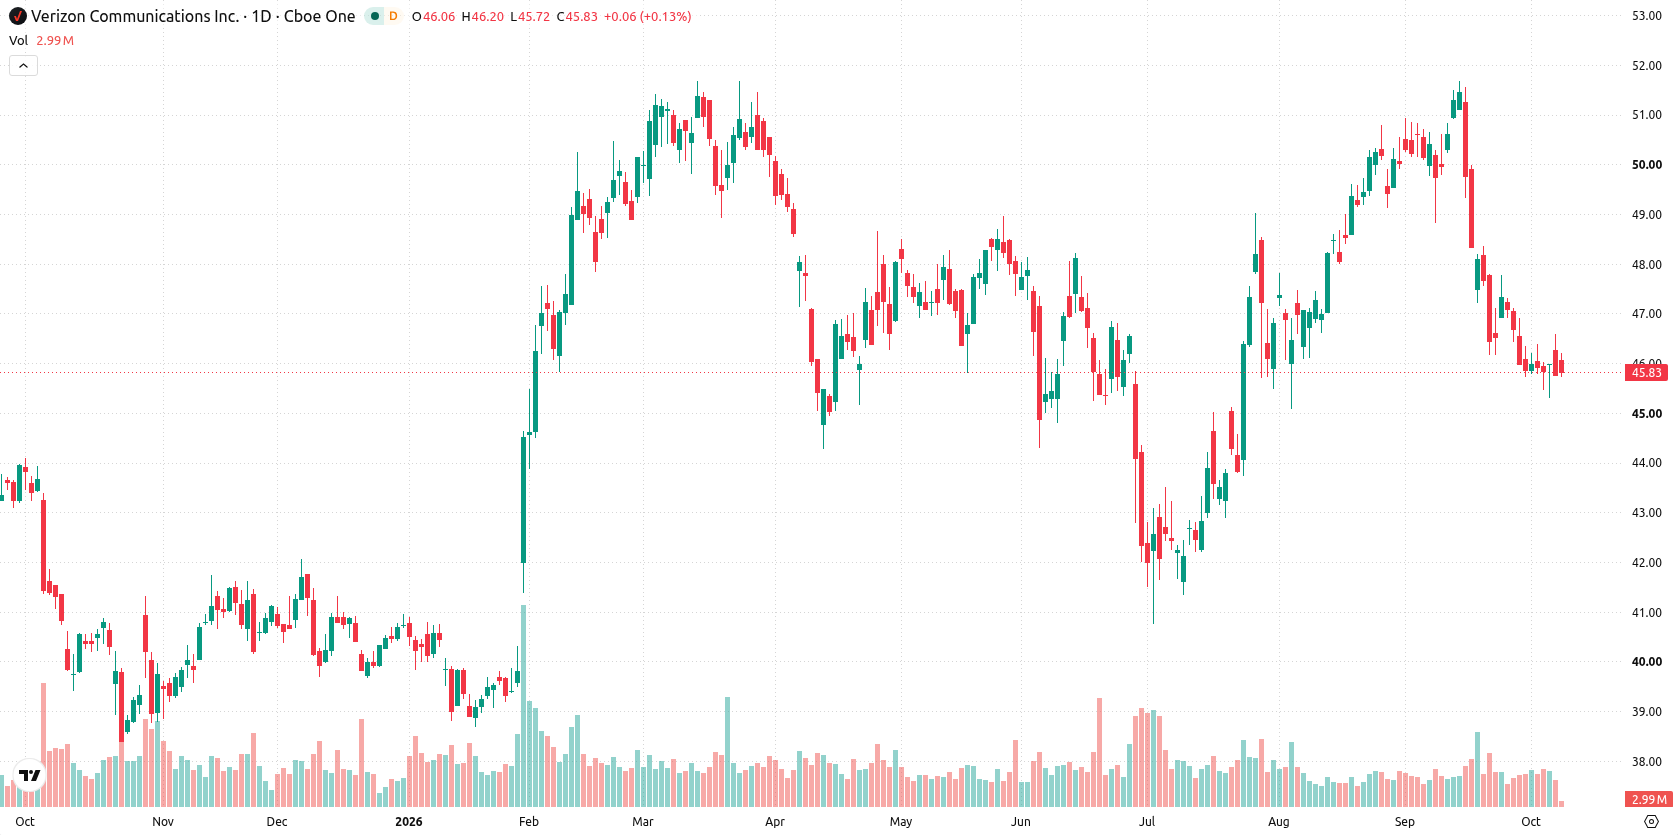
Oversold momentum deepens as volatility and resistance cap weekly upside
On the daily setup, price action shows a developing trend with 2.8% volatility over the past seven days and an emerging move lower that is not yet confirmed. RSI is at 34.1, approaching oversold territory, and Stoch RSI sits in the oversold zone, adding to the downside risk as, at the same time, the MACD continues to point lower. Key levels to watch are support at $45.3 and resistance at $46.49, which coincides with the daily MA-200, while the Ichimoku Kijun at $48.48 acts as a higher resistance area. The confluence of oversold momentum and persistent resistance above suggests downside pressure remains prevalent in the short term.
Downside bias dominates weekly outlook amid high breakout risk below support
For the next five trading days, the expected range is $45.3 to $46.43, with a very high probability (more than 80%) of a decrease and a very low probability (less than 20%) of an increase. If the stock remains between support and resistance, expect continued pressure within the range as the base case. Any sustained push above $46.49 would shift momentum more positively. A break below $45.3 could open up further downside risk in the near term.
Earlier, analysts noted that Verizon remained under persistent selling pressure, with technical signs pointing to a cautious outlook. The current article adds a fresh layer by highlighting ongoing downside risks supported by recent volatility data, making the $45.3 support level critical to monitor for signs of further weakness or potential stabilization.






Latest Verizon News



-
 Afghanistan
-
 Albania
-
 Algeria
-
 Angola
-
 Argentina
-
 Armenia
-
 Australia
-
 Austria
-
 Azerbaijan
-
 Bahamas
-
 Bahrain
-
 Bangladesh
-
 Belarus
-
 Belgium
-
 Bolivia
-
 Botswana
-
 Brazil
-
 Brunei
-
 Bulgaria
-
 Cambodia
-
 Cameroon
-
 Canada
-
 Chile
-
 China
-
 Colombia
-
 Congo
-
 Costa Rica
-
 Cote d'Ivoire
-
 Croatia
-
 Cuba
-
 Cyprus
-
 Czechia
-
 DR Congo
-
 Denmark
-
 Dominican Republic
-
 Ecuador
-
 Egypt
-
 El Salvador
-
 Estonia
-
 Eswatini
-
 Ethiopia
-
 Finland
-
 France
-
 Georgia
-
 Germany
-
 Ghana
-
 Greece
-
 Haiti
-
 Hong Kong
-
 Hungary
-
 India
-
 Indonesia
-
 Iran, Islamic republic
-
 Iraq
-
 Ireland
-
 Israel
-
 Italy
-
 Jamaica
-
 Japan
-
 Jordan
-
 Kazakhstan
-
 Kenya
-
 Korea
-
 Kuwait
-
 Kyrgyzstan
-
 Laos
-
 Latvia
-
 Lebanon
-
 Lesotho
-
 Libya
-
 Lithuania
-
 Luxembourg
-
 Madagascar
-
 Malaysia
-
 Malta
-
 Mauritius
-
 Mexico
-
 Moldova
-
 Mongolia
-
 Montenegro
-
 Morocco
-
 Mozambique
-
 Myanmar
-
 Namibia
-
 Nepal
-
 Netherlands
-
 New Zealand
-
 Nigeria
-
 North Macedonia
-
 Norway
-
 Oman
-
 Pakistan
-
 Palestine
-
 Panama
-
 Papua New Guinea
-
 Paraguay
-
 Peru
-
 Philippines
-
 Poland
-
 Portugal
-
 Puerto Rico
-
 Qatar
-
 Reunion
-
 Romania
-
 Rwanda
-
 Saudi Arabia
-
 Serbia
-
 Singapore
-
 Slovakia
-
 Slovenia
-
 Somalia
-
 South Africa
-
 Spain
-
 Sri Lanka
-
 Sweden
-
 Switzerland
-
 Syria
-
 Taiwan
-
 Tajikistan
-
 Tanzania
-
 Thailand
-
 Trinidad and Tobago
-
 Tunisia
-
 Turkey
-
 UAE
-
 Uganda
-
 Ukraine
-
 United Kingdom
-
United States
-
 Uruguay
-
 Uzbekistan
-
 Venezuela
-
 Vietnam
-
 Yemen
-
 Zambia
-
 Zimbabwe
- Forex
- Crypto












