

Riot Platforms shares technical analysis: Support test at $15.95 key for direction

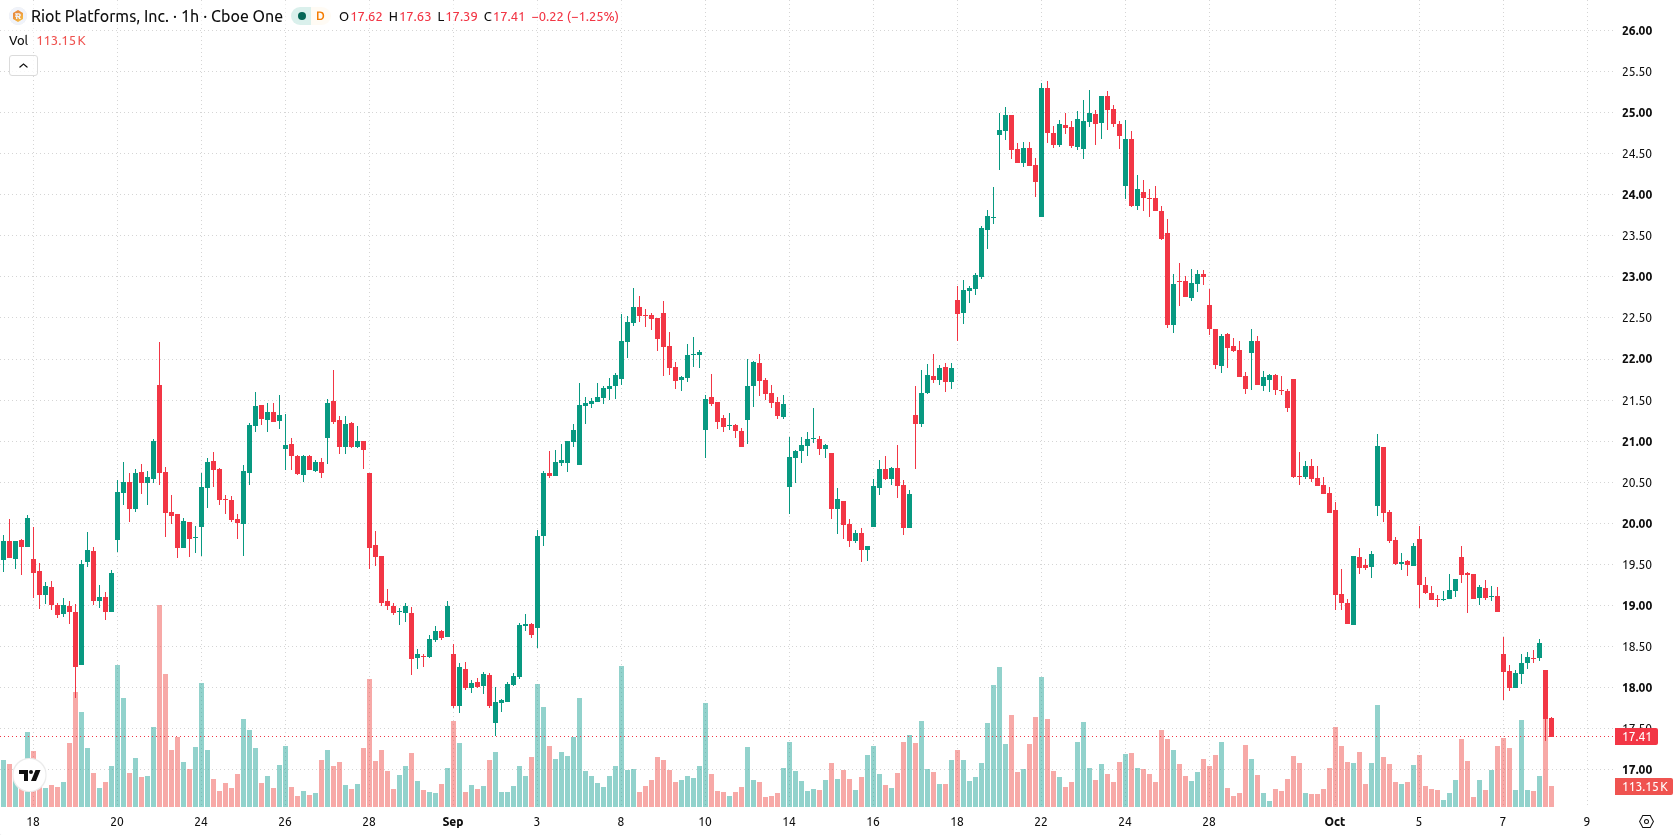
Riot Platforms (RIOT) stock is trading at $17.38 after a decline of 6.31% on the day, closing near its session low. The price action remains well below its key moving averages, reflecting firm downward momentum.
 12.87
14.44
Highlights
- RIOT stock trades below key moving averages on all timeframes as sellers maintain pressure.
- Momentum indicators collectively indicate a persistent sell bias, with weak buying activity and signs of intraday seller exhaustion.
- Price closed at $17.38, down 6.31% on the day, with a projected trading range of $15.95 to $18.82 and a high probability of continued decline.
Bearish momentum intensifies as sell signals cluster below resistance
RIOT is currently trading beneath the MA-20 ($18.85), MA-50 ($19.75), and MA-200 ($19.42) on the hourly chart, with immediate resistance identified at the Ichimoku Kijun level ($18.99). On the momentum side, MACD shows a strong sell, ADX indicates a continued sell bias, and major oscillators like RSI (39.4, sell) and CCI also point to a lack of buying strength. However, Stoch RSI signals overbought conditions, implying some short-term seller exhaustion within a generally bearish technical backdrop. Bull/Bear Power confirms seller dominance during intraday trading, and today's price action was marked by a gap down and persistent downside pressure, though oscillator divergence could lead to brief counter-moves.
Downside risk elevated as volatility range persists
Looking forward, the anticipated short-term trading range for RIOT is $15.95 to $18.82, reflecting the typical volatility band relative to current levels. The probability of a continued decline remains high, while the likelihood of a near-term recovery is low. Baseline expectations call for sideways fluctuation within this range; a decisive break above $18.99 could trigger a rebound scenario, whereas a fall below $15.95 would likely accelerate further downside.
Earlier, analysts noted that Riot Platforms was experiencing persistent technical weakness and sustained downside momentum. The current analysis reinforces this view with new intraday data, highlighting $15.95 as the key support level to monitor for potential acceleration of losses.









-
 Afghanistan
-
 Albania
-
 Algeria
-
 Angola
-
 Argentina
-
 Armenia
-
 Australia
-
 Austria
-
 Azerbaijan
-
 Bahamas
-
 Bahrain
-
 Bangladesh
-
 Belarus
-
 Belgium
-
 Bolivia
-
 Botswana
-
 Brazil
-
 Brunei
-
 Bulgaria
-
 Cambodia
-
 Cameroon
-
 Canada
-
 Chile
-
 China
-
 Colombia
-
 Congo
-
 Costa Rica
-
 Cote d'Ivoire
-
 Croatia
-
 Cuba
-
 Cyprus
-
 Czechia
-
 DR Congo
-
 Denmark
-
 Dominican Republic
-
 Ecuador
-
 Egypt
-
 El Salvador
-
 Estonia
-
 Eswatini
-
 Ethiopia
-
 Finland
-
 France
-
 Georgia
-
 Germany
-
 Ghana
-
 Greece
-
 Haiti
-
 Hong Kong
-
 Hungary
-
 India
-
 Indonesia
-
 Iran, Islamic republic
-
 Iraq
-
 Ireland
-
 Israel
-
 Italy
-
 Jamaica
-
 Japan
-
 Jordan
-
 Kazakhstan
-
 Kenya
-
 Korea
-
 Kuwait
-
 Kyrgyzstan
-
 Laos
-
 Latvia
-
 Lebanon
-
 Lesotho
-
 Libya
-
 Lithuania
-
 Luxembourg
-
 Madagascar
-
 Malaysia
-
 Malta
-
 Mauritius
-
 Mexico
-
 Moldova
-
 Mongolia
-
 Montenegro
-
 Morocco
-
 Mozambique
-
 Myanmar
-
 Namibia
-
 Nepal
-
 Netherlands
-
 New Zealand
-
 Nigeria
-
 North Macedonia
-
 Norway
-
 Oman
-
 Pakistan
-
 Palestine
-
 Panama
-
 Papua New Guinea
-
 Paraguay
-
 Peru
-
 Philippines
-
 Poland
-
 Portugal
-
 Puerto Rico
-
 Qatar
-
 Reunion
-
 Romania
-
 Rwanda
-
 Saudi Arabia
-
 Serbia
-
 Singapore
-
 Slovakia
-
 Slovenia
-
 Somalia
-
 South Africa
-
 Spain
-
 Sri Lanka
-
 Sweden
-
 Switzerland
-
 Syria
-
 Taiwan
-
 Tajikistan
-
 Tanzania
-
 Thailand
-
 Trinidad and Tobago
-
 Tunisia
-
 Turkey
-
 UAE
-
 Uganda
-
 Ukraine
-
 United Kingdom
-
United States
-
 Uruguay
-
 Uzbekistan
-
 Venezuela
-
 Vietnam
-
 Yemen
-
 Zambia
-
 Zimbabwe
- Forex
- Crypto












