

Salesforce stock remains pinned to 50-day moving average as volatility holds: weekly analysis

Shares of Salesforce, Inc. (CRM) are trading near $223 after a slide of nearly 5% over the past week, as the decline stretches into oversold territory and technical signals remain conflicted. The chart reveals wavering momentum, with selling pressure present but lacking a decisive trend — prompting traders to watch for consolidation heading into the new week.
 233.00
248.80
Highlights
- Shares of Salesforce fell 4.92% over the past week to $222.95, trading just below the 50-day average.
- The stock remains above its 200-day average, indicating a bullish long-term trend despite near-term selling pressure.
- Technical indicators are mixed with oversold momentum signals and suggest a likely trading range of $212.89 to $230.45 over the next five days.
Record buyback and Listen Labs acquisition heighten debt burden amid robust cash flow
CRM executed the largest accelerated share repurchase in history, buying back $25 billion in stock as part of a $50 billion authorization, according to Yahoo Finance. The company's noncurrent debt reached $39.29 billion by July 31, 2026, mainly due to the buyback, while it posted $17.73 billion in levered free cash flow over the last twelve months. CRM also declared a quarterly dividend of $0.44 per share and acquired AI customer research startup Listen Labs in a $2 billion deal, bolstering its AI and commerce security capabilities.
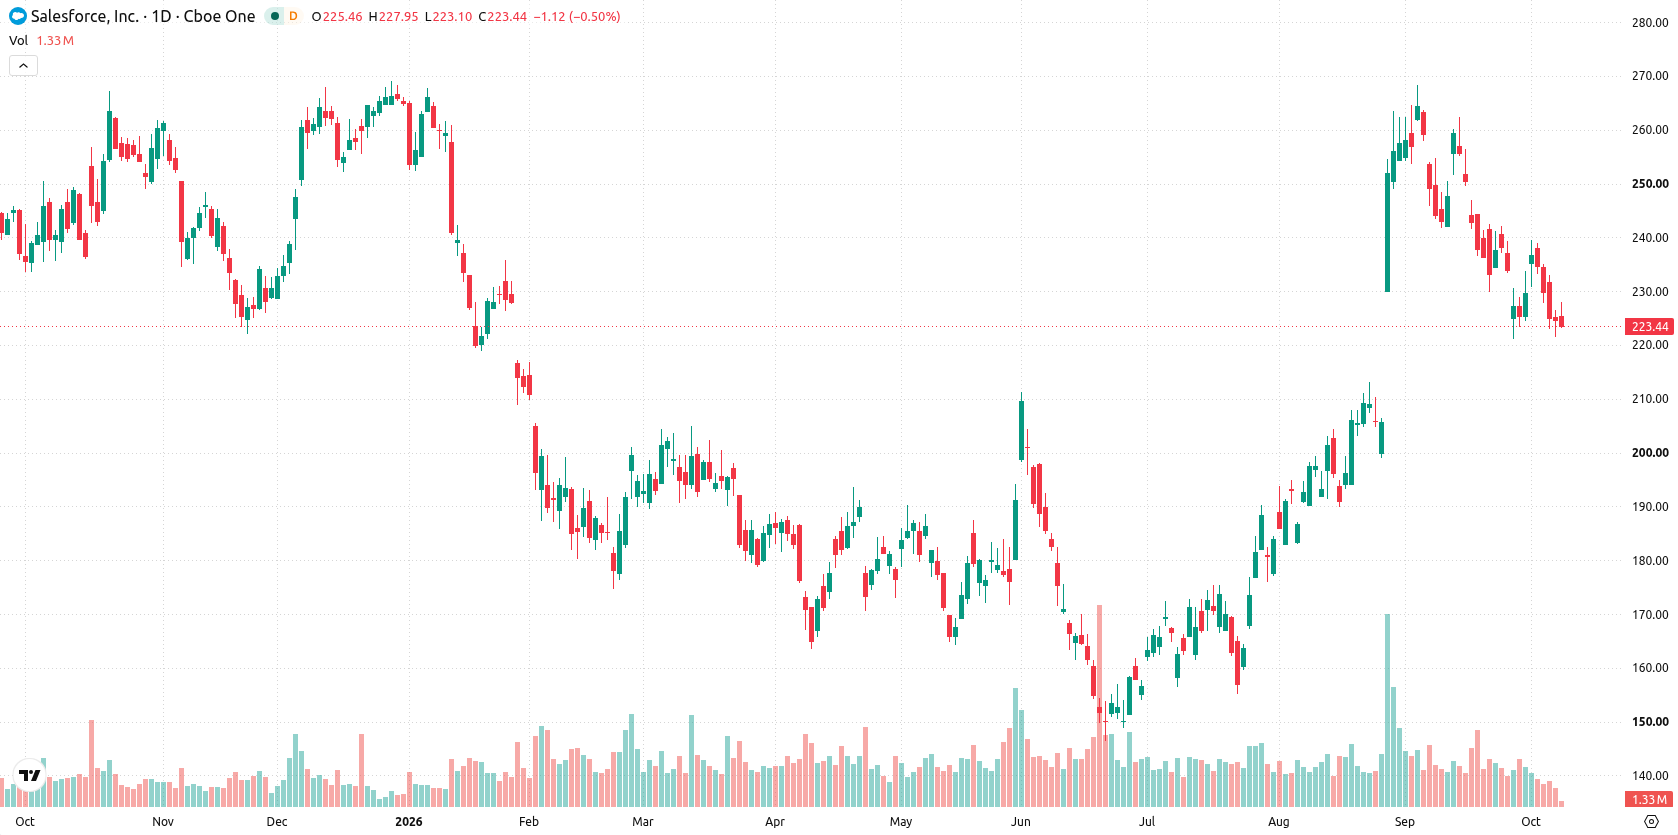
Narrow price range prevails as oversold CCI contrasts with neutral RSI
The daily chart shows price action pinned to the 50-day moving average, with volatility over the past week at 7.58%. While CCI is firmly in oversold territory at -121.47, the RSI holds in a neutral zone, highlighting a divergence in momentum signals. Immediate resistance is at $223.26 and support is found near $221.62, while the Ichimoku Kijun at $244.58 acts as a higher resistance level. This points to a contained move within a narrow range, as selling pressure dominates but is not yet decisive enough for a clear trend.
Consolidation favored this week unless key support or resistance is breached
Over the next five trading days, Salesforce is expected to trade between $212.89 and $230.45, with a 56% probability of an increase versus 44% for a decrease. The base case is further consolidation between the support at $221.62 and resistance at $223.26. A bullish scenario would require a sustained break above $223.26, while a bearish move could develop if support at $221.62 fails.
Earlier, analysts noted that despite short-term volatility and mixed technical signals, Salesforce maintained a bullish medium- and long-term technical structure. New information on the record-breaking buyback program, elevated debt levels, and a major AI acquisition strengthens that framework, with the current chart suggesting traders should monitor the $221.62–$223.26 range for a potential directional breakout in the days ahead.






Latest Salesforce News




-
 Afghanistan
-
 Albania
-
 Algeria
-
 Angola
-
 Argentina
-
 Armenia
-
 Australia
-
 Austria
-
 Azerbaijan
-
 Bahamas
-
 Bahrain
-
 Bangladesh
-
 Belarus
-
 Belgium
-
 Bolivia
-
 Botswana
-
 Brazil
-
 Brunei
-
 Bulgaria
-
 Cambodia
-
 Cameroon
-
 Canada
-
 Chile
-
 China
-
 Colombia
-
 Congo
-
 Costa Rica
-
 Cote d'Ivoire
-
 Croatia
-
 Cuba
-
 Cyprus
-
 Czechia
-
 DR Congo
-
 Denmark
-
 Dominican Republic
-
 Ecuador
-
 Egypt
-
 El Salvador
-
 Estonia
-
 Eswatini
-
 Ethiopia
-
 Finland
-
 France
-
 Georgia
-
 Germany
-
 Ghana
-
 Greece
-
 Haiti
-
 Hong Kong
-
 Hungary
-
 India
-
 Indonesia
-
 Iran, Islamic republic
-
 Iraq
-
 Ireland
-
 Israel
-
 Italy
-
 Jamaica
-
 Japan
-
 Jordan
-
 Kazakhstan
-
 Kenya
-
 Korea
-
 Kuwait
-
 Kyrgyzstan
-
 Laos
-
 Latvia
-
 Lebanon
-
 Lesotho
-
 Libya
-
 Lithuania
-
 Luxembourg
-
 Madagascar
-
 Malaysia
-
 Malta
-
 Mauritius
-
 Mexico
-
 Moldova
-
 Mongolia
-
 Montenegro
-
 Morocco
-
 Mozambique
-
 Myanmar
-
 Namibia
-
 Nepal
-
 Netherlands
-
 New Zealand
-
 Nigeria
-
 North Macedonia
-
 Norway
-
 Oman
-
 Pakistan
-
 Palestine
-
 Panama
-
 Papua New Guinea
-
 Paraguay
-
 Peru
-
 Philippines
-
 Poland
-
 Portugal
-
 Puerto Rico
-
 Qatar
-
 Reunion
-
 Romania
-
 Rwanda
-
 Saudi Arabia
-
 Serbia
-
 Singapore
-
 Slovakia
-
 Slovenia
-
 Somalia
-
 South Africa
-
 Spain
-
 Sri Lanka
-
 Sweden
-
 Switzerland
-
 Syria
-
 Taiwan
-
 Tajikistan
-
 Tanzania
-
 Thailand
-
 Trinidad and Tobago
-
 Tunisia
-
 Turkey
-
 UAE
-
 Uganda
-
 Ukraine
-
 United Kingdom
-
United States
-
 Uruguay
-
 Uzbekistan
-
 Venezuela
-
 Vietnam
-
 Yemen
-
 Zambia
-
 Zimbabwe
- Forex
- Crypto












