

Salesforce shares drop more than 2% after breaking below 20-day moving average amid increased selling pressure

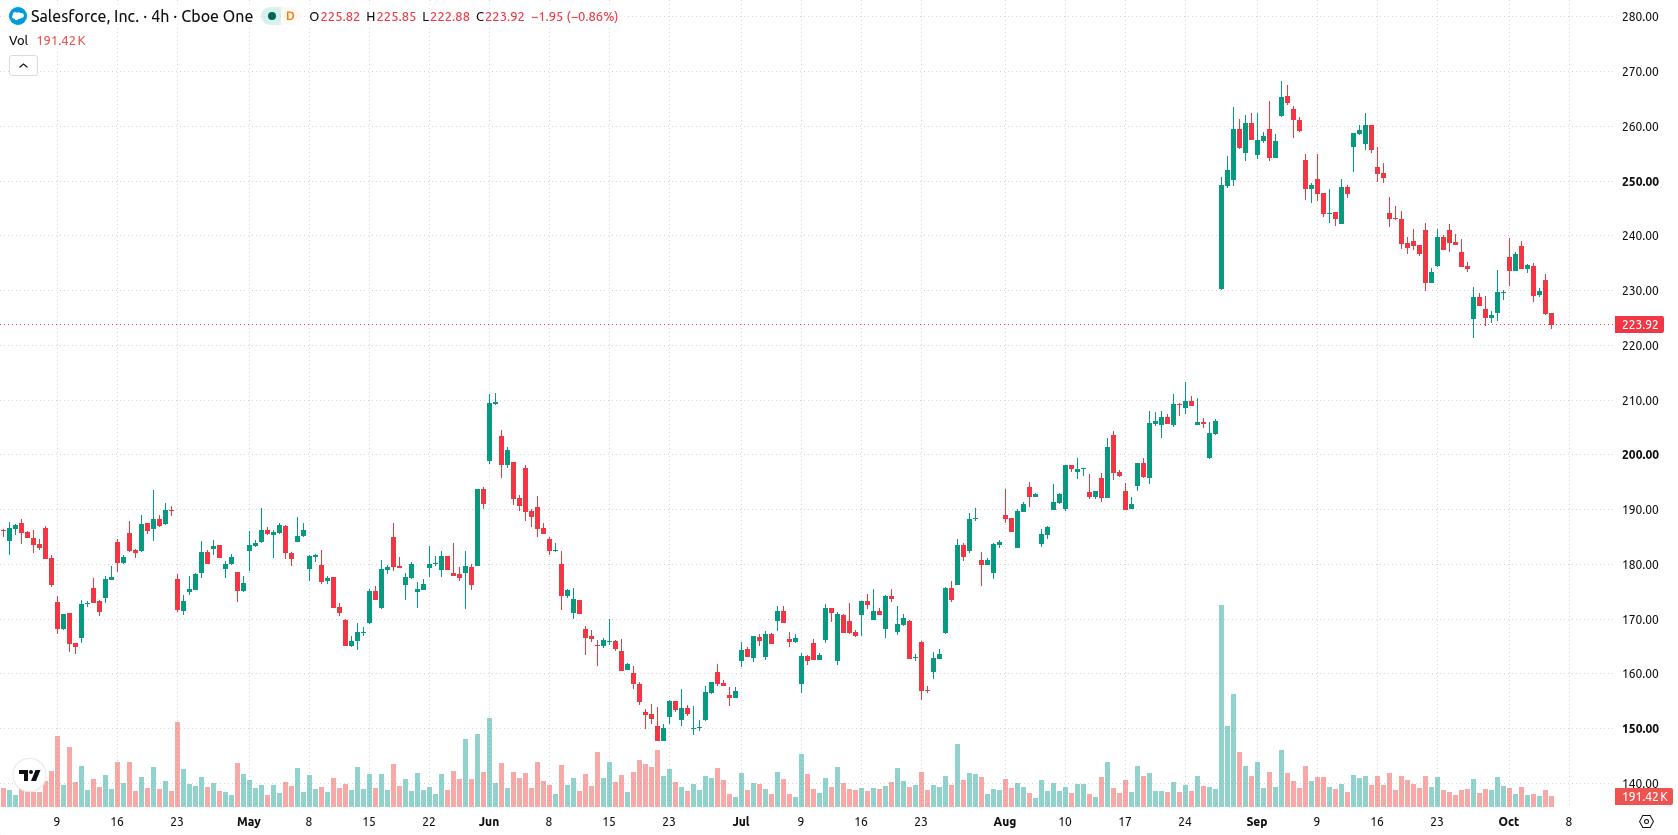
Salesforce, Inc. (CRM) dropped 2.22% as short-term selling pressure intensified, even as the company reported strong earnings growth and is engaged in a $50 billion buyback program. The move is supported by momentum indicators showing oversold conditions and a break below the 20-day moving average, which highlights sustained weakness despite a bullish medium-term technical structure.
 233.00
248.80
Highlights
- Salesforce earnings surged 86.9% and revenue rose 10.8%, delivering strong growth in the latest reported period.
- The company executed a $50 billion share buyback, sustained a $0.44 dividend, and free cash flow reached 7.8% of market value.
- Salesforce stock faces short-term selling and trades below key moving averages, with a forecast range of $219.09 to $229.96 over five days.
Earnings surge and buyback support offset by persistent selling flows
Salesforce reported an 86.9% increase in earnings and a 10.8% rise in revenue in its most recent period. The company is conducting a $50 billion share buyback. Its free cash flow over the last twelve months reached 7.8% of market value, and Salesforce maintained a quarterly dividend of $0.44 per share, though price action has remained under broader selling pressure.
Mixed technical signals amid downside move and oversold readings
Salesforce is trading below its 20-day moving average (MA-20) at $239.68, but remains above its 50-day ($221.38) and 200-day ($200.36) moving averages. This points to a continued bullish structure in the medium and long term, while the current drop signals increased short-term pressure. The Ichimoku Kijun at $244.97 acts as distant resistance. Important near-term levels include resistance at $227.92 and support at $222.88. Momentum signals are mixed: MACD suggests strong upside momentum, but the Average Directional Index (ADX) is neutral. The Relative Strength Index (RSI) at 47.44, Commodity Channel Index (CCI) at -91.71, Stochastic RSI at 18.33, and Bull/Bear Power (BBP) at -2.13 all show dominance of sellers and oversold conditions. The Awesome Oscillator (AO) confirms the price trend is downward. Salesforce is trading near its daily low with heightened intraday volatility of 3.39%, and the downside move reflects the prevailing momentum signals, while the MACD suggests some potential for divergence from the short-term selling.
Earlier, analysts noted that Salesforce’s medium- and long-term bullish structure remained intact despite short-term volatility and mixed momentum signals. The current analysis strengthens this view with new evidence of oversold technical conditions and highlights $229.96 and $219.09 as key levels to watch for the next directional move.






Latest Salesforce News




-
 Afghanistan
-
 Albania
-
 Algeria
-
 Angola
-
 Argentina
-
 Armenia
-
 Australia
-
 Austria
-
 Azerbaijan
-
 Bahamas
-
 Bahrain
-
 Bangladesh
-
 Belarus
-
 Belgium
-
 Bolivia
-
 Botswana
-
 Brazil
-
 Brunei
-
 Bulgaria
-
 Cambodia
-
 Cameroon
-
 Canada
-
 Chile
-
 China
-
 Colombia
-
 Congo
-
 Costa Rica
-
 Cote d'Ivoire
-
 Croatia
-
 Cuba
-
 Cyprus
-
 Czechia
-
 DR Congo
-
 Denmark
-
 Dominican Republic
-
 Ecuador
-
 Egypt
-
 El Salvador
-
 Estonia
-
 Eswatini
-
 Ethiopia
-
 Finland
-
 France
-
 Georgia
-
 Germany
-
 Ghana
-
 Greece
-
 Haiti
-
 Hong Kong
-
 Hungary
-
 India
-
 Indonesia
-
 Iran, Islamic republic
-
 Iraq
-
 Ireland
-
 Israel
-
 Italy
-
 Jamaica
-
 Japan
-
 Jordan
-
 Kazakhstan
-
 Kenya
-
 Korea
-
 Kuwait
-
 Kyrgyzstan
-
 Laos
-
 Latvia
-
 Lebanon
-
 Lesotho
-
 Libya
-
 Lithuania
-
 Luxembourg
-
 Madagascar
-
 Malaysia
-
 Malta
-
 Mauritius
-
 Mexico
-
 Moldova
-
 Mongolia
-
 Montenegro
-
 Morocco
-
 Mozambique
-
 Myanmar
-
 Namibia
-
 Nepal
-
 Netherlands
-
 New Zealand
-
 Nigeria
-
 North Macedonia
-
 Norway
-
 Oman
-
 Pakistan
-
 Palestine
-
 Panama
-
 Papua New Guinea
-
 Paraguay
-
 Peru
-
 Philippines
-
 Poland
-
 Portugal
-
 Puerto Rico
-
 Qatar
-
 Reunion
-
 Romania
-
 Rwanda
-
 Saudi Arabia
-
 Serbia
-
 Singapore
-
 Slovakia
-
 Slovenia
-
 Somalia
-
 South Africa
-
 Spain
-
 Sri Lanka
-
 Sweden
-
 Switzerland
-
 Syria
-
 Taiwan
-
 Tajikistan
-
 Tanzania
-
 Thailand
-
 Trinidad and Tobago
-
 Tunisia
-
 Turkey
-
 UAE
-
 Uganda
-
 Ukraine
-
 United Kingdom
-
United States
-
 Uruguay
-
 Uzbekistan
-
 Venezuela
-
 Vietnam
-
 Yemen
-
 Zambia
-
 Zimbabwe
- Forex
- Crypto












