

TSMC stock pullback deepens as revenue declines month-on-month

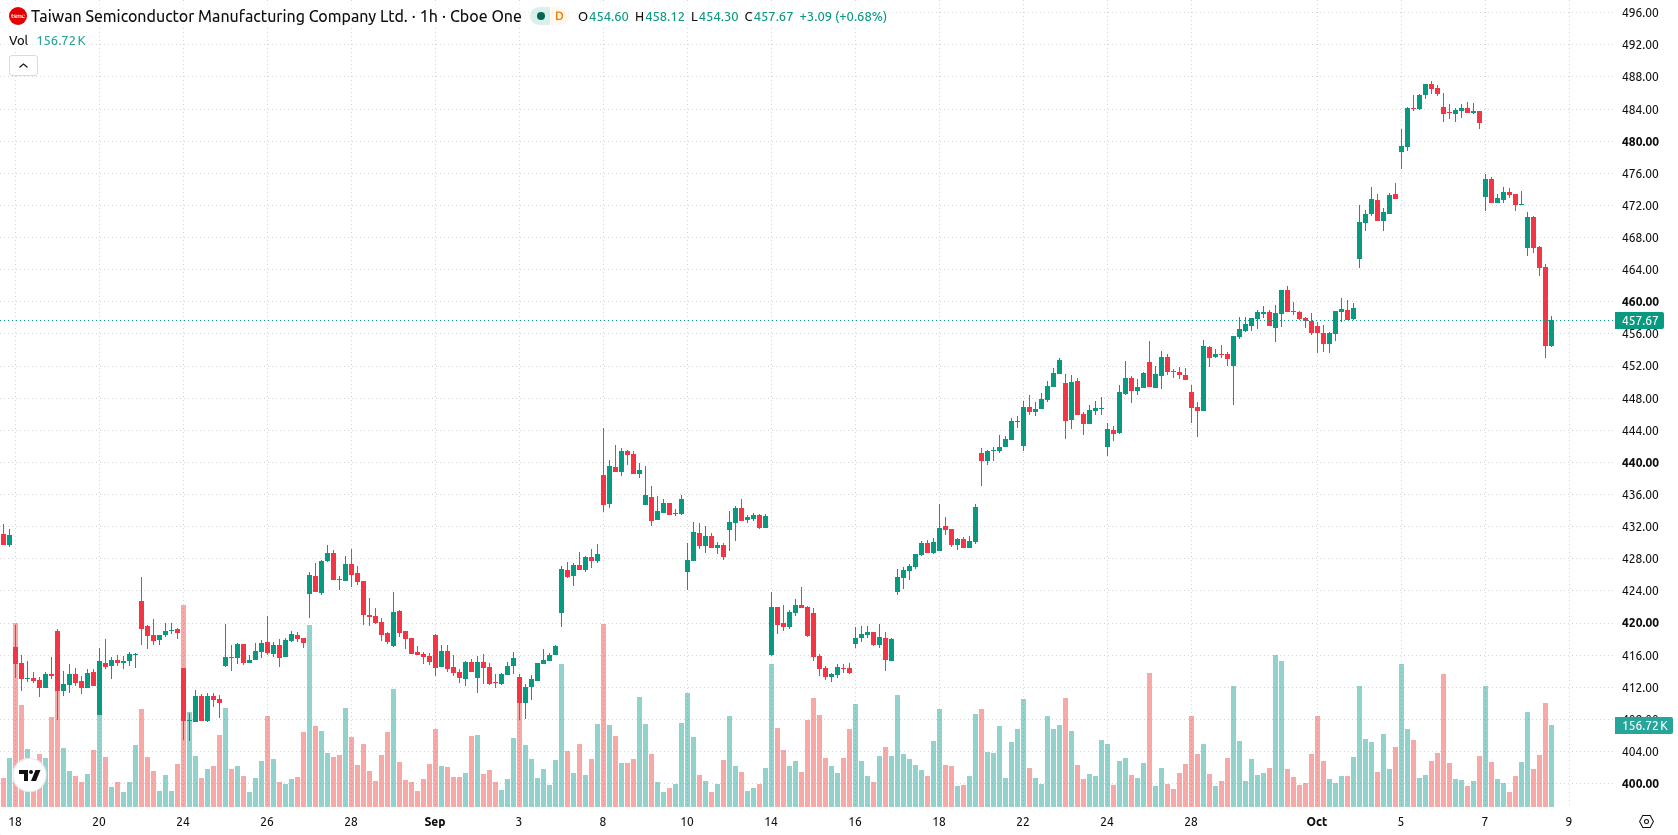
Taiwan Semiconductor Manufacturing Company Limited (TSM) stock is trading at $457.1 after falling 3.32% on the day. The shares are currently positioned below their short- and medium-term moving averages, while remaining above longer-term average levels.
 415.44
440.82
Highlights
- TSMC reported record Q3 2026 revenue of NT$1.49 trillion, driven by strong AI-related semiconductor demand.
- Nine-month 2026 revenue reached NT$3.899 trillion, up 41.1% year-on-year, but shares remain under broad selling pressure.
- TSMC stock trades below key short- and medium-term moving averages, with technicals indicating dominant downside signals and a projected range of $447.33 to $466.87.
Revenue surges as AI demand offsets persistent selling pressure
TSMC achieved record third-quarter 2026 revenue of NT$1.49 trillion (approximately $46.71 billion), with growth driven by increasing demand for AI-related semiconductor products, according to Seekingalpha. This momentum was further reflected in September 2026 revenue of NT$511.86 billion (about $16.07 billion), a 54.6% rise year-on-year that points to sustained expansion in core business segments, as reported by Pr Tsmc. Cumulative revenue for the first nine months of 2026 climbed 41.1% on the year to NT$3.899 trillion (approximately $122.1 billion), according to Business Standard, though price action has remained under broader selling pressure.
Bearish momentum and oversold signals amid long-term support
On the technical front, TSM trades below both its MA-20 and MA-50 on the H1 timeframe, highlighting short- and medium-term resistance zones, while the price remains well above the MA-200, confirming ongoing long-term support. The Ichimoku Kijun sits at $478.11, establishing immediate resistance. Momentum readings are bearish, with both RSI and CCI in sell territory and Stochastic RSI registering oversold levels. Additional downside pressure is indicated by negative Bull/Bear Power, sell signals from ADX and the Awesome Oscillator, and a neutral MACD.
Sideways outlook persists as bearish probability prevails
For the short term, TSM is expected to trade between $447.33 and $466.87, reflecting its recent volatility band. Given a 68% probability for a downward move versus 32% for a rebound, the baseline scenario is continued sideways action within this range. A break above $478.11 would be required for a bullish reversal, while a breach of the lower boundary would reinforce the bearish outlook.
Earlier, analysts noted that capacity expansions for advanced AI chip packaging in the U.S. are set to address key constraints in the semiconductor supply chain. Today’s technical and revenue-driven findings reinforce a cautious outlook for TSMC shares, with the $478.11 resistance level remaining a pivotal threshold for any potential upward reversal in the near term.






Latest TSMC News




-
 Afghanistan
-
 Albania
-
 Algeria
-
 Angola
-
 Argentina
-
 Armenia
-
 Australia
-
 Austria
-
 Azerbaijan
-
 Bahamas
-
 Bahrain
-
 Bangladesh
-
 Belarus
-
 Belgium
-
 Bolivia
-
 Botswana
-
 Brazil
-
 Brunei
-
 Bulgaria
-
 Cambodia
-
 Cameroon
-
 Canada
-
 Chile
-
 China
-
 Colombia
-
 Congo
-
 Costa Rica
-
 Cote d'Ivoire
-
 Croatia
-
 Cuba
-
 Cyprus
-
 Czechia
-
 DR Congo
-
 Denmark
-
 Dominican Republic
-
 Ecuador
-
 Egypt
-
 El Salvador
-
 Estonia
-
 Eswatini
-
 Ethiopia
-
 Finland
-
 France
-
 Georgia
-
 Germany
-
 Ghana
-
 Greece
-
 Haiti
-
 Hong Kong
-
 Hungary
-
 India
-
 Indonesia
-
 Iran, Islamic republic
-
 Iraq
-
 Ireland
-
 Israel
-
 Italy
-
 Jamaica
-
 Japan
-
 Jordan
-
 Kazakhstan
-
 Kenya
-
 Korea
-
 Kuwait
-
 Kyrgyzstan
-
 Laos
-
 Latvia
-
 Lebanon
-
 Lesotho
-
 Libya
-
 Lithuania
-
 Luxembourg
-
 Madagascar
-
 Malaysia
-
 Malta
-
 Mauritius
-
 Mexico
-
 Moldova
-
 Mongolia
-
 Montenegro
-
 Morocco
-
 Mozambique
-
 Myanmar
-
 Namibia
-
 Nepal
-
 Netherlands
-
 New Zealand
-
 Nigeria
-
 North Macedonia
-
 Norway
-
 Oman
-
 Pakistan
-
 Palestine
-
 Panama
-
 Papua New Guinea
-
 Paraguay
-
 Peru
-
 Philippines
-
 Poland
-
 Portugal
-
 Puerto Rico
-
 Qatar
-
 Reunion
-
 Romania
-
 Rwanda
-
 Saudi Arabia
-
 Serbia
-
 Singapore
-
 Slovakia
-
 Slovenia
-
 Somalia
-
 South Africa
-
 Spain
-
 Sri Lanka
-
 Sweden
-
 Switzerland
-
 Syria
-
 Taiwan
-
 Tajikistan
-
 Tanzania
-
 Thailand
-
 Trinidad and Tobago
-
 Tunisia
-
 Turkey
-
 UAE
-
 Uganda
-
 Ukraine
-
 United Kingdom
-
United States
-
 Uruguay
-
 Uzbekistan
-
 Venezuela
-
 Vietnam
-
 Yemen
-
 Zambia
-
 Zimbabwe
- Forex
- Crypto












