

XOM climbs as accelerated exploration progress in Trinidad and Tobago boosts sentiment

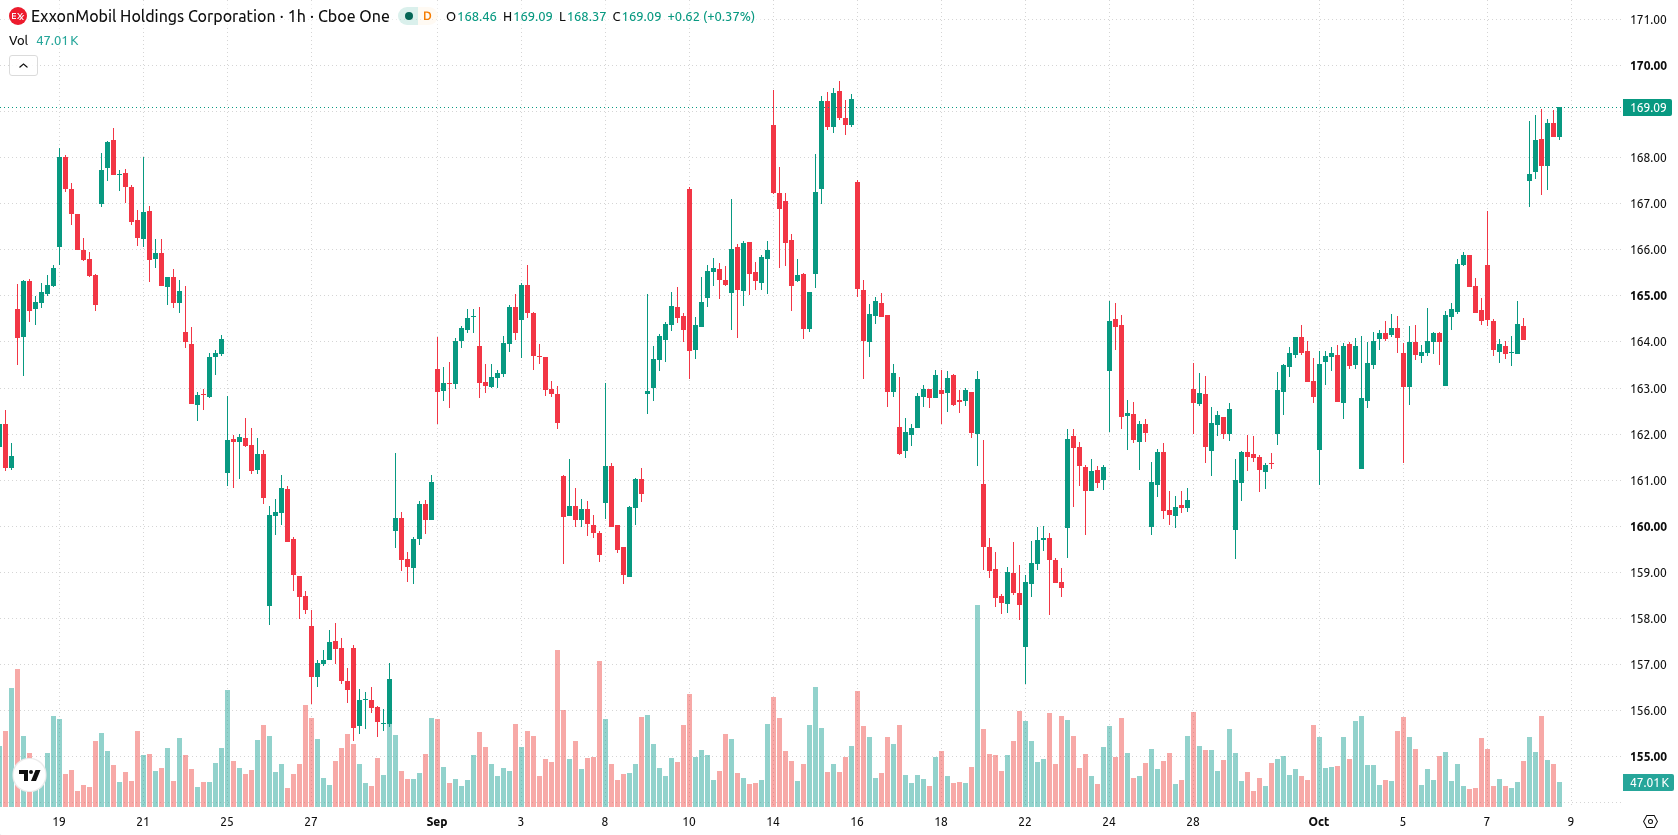
Exxon Mobil (XOM) stock is trading at $169.09, up 3.07% on the day. The price holds firmly above its key moving averages, reflecting strong bullish momentum across short, medium, and long-term trends.
 166.64
183.82
Highlights
- The SEC has increased regulatory scrutiny on disclosure requirements for asset managers and activists after the 2021 Exxon Mobil shareholder campaign.
- Exxon Mobil will accelerate exploration in Trinidad and Tobago to increase oil production and strengthen ongoing dividend plans.
- Shares of Exxon Mobil closed at $169.09 following a 3.07% rally, with technical indicators showing strong bullish momentum and an expected near-term range of $166.96 to $171.22.
SEC scrutiny and exploration boost shift institutional outlook
The U.S. Securities and Exchange Commission has formally reminded asset managers and activist investors about disclosure obligations stemming from the 2021 Exxon Mobil climate-focused shareholder campaign, as reported by Gurufocus, Mlex, and Investmentnews. This regulatory attention intensifies compliance considerations around large-scale coordinated campaigns and is likely to influence institutional sentiment toward Exxon Mobil, especially regarding future shareholder activities. Separately, ExxonMobil announced it is accelerating exploration in Trinidad and Tobago to boost oil output, a development that supports ongoing dividend priorities and may attract investor interest, according to Gurufocus.
Overbought signals accompany strong technical support for buyers
On the hourly chart, the price stands well above the MA-20 at $164.62 and MA-50 at $163.7, with daily support from the MA-200 positioned at $149.81. The Ichimoku Kijun provides immediate support at $165.19. Technical momentum indicators are solidly positive: MACD, ADX, and Awesome Oscillator all give a strong buy signal, while RSI, Stochastic RSI, CCI, and Bull/Bear Power are in overbought or strong buyer territory. This alignment points to robust buyer dominance, though short-term caution is warranted due to overbought indicator levels.
Consolidation likely as resistance faces persistent upward momentum
Over the next several days, the expected trading range is $166.96 to $171.22. The most probable scenario is price consolidation within this band, with a high likelihood of continued strength if resistance is cleared. Should the price break below $166.96, a bearish scenario would emerge, though this remains unlikely based on prevailing momentum. Volatility is expected to stay limited relative to current conditions.
Earlier, analysts noted that Exxon Mobil was advancing its Trinidad and Tobago exploration initiatives while maintaining robust shareholder return strategies, supported by technically strong price action. The current update adds regulatory scrutiny as a new consideration alongside continued bullish momentum, making the $166.96–$171.22 range and any decisive move beyond these levels key factors for traders to monitor in the coming sessions.






Latest Exxon News





-
 Afghanistan
-
 Albania
-
 Algeria
-
 Angola
-
 Argentina
-
 Armenia
-
 Australia
-
 Austria
-
 Azerbaijan
-
 Bahamas
-
 Bahrain
-
 Bangladesh
-
 Belarus
-
 Belgium
-
 Bolivia
-
 Botswana
-
 Brazil
-
 Brunei
-
 Bulgaria
-
 Cambodia
-
 Cameroon
-
 Canada
-
 Chile
-
 China
-
 Colombia
-
 Congo
-
 Costa Rica
-
 Cote d'Ivoire
-
 Croatia
-
 Cuba
-
 Cyprus
-
 Czechia
-
 DR Congo
-
 Denmark
-
 Dominican Republic
-
 Ecuador
-
 Egypt
-
 El Salvador
-
 Estonia
-
 Eswatini
-
 Ethiopia
-
 Finland
-
 France
-
 Georgia
-
 Germany
-
 Ghana
-
 Greece
-
 Haiti
-
 Hong Kong
-
 Hungary
-
 India
-
 Indonesia
-
 Iran, Islamic republic
-
 Iraq
-
 Ireland
-
 Israel
-
 Italy
-
 Jamaica
-
 Japan
-
 Jordan
-
 Kazakhstan
-
 Kenya
-
 Korea
-
 Kuwait
-
 Kyrgyzstan
-
 Laos
-
 Latvia
-
 Lebanon
-
 Lesotho
-
 Libya
-
 Lithuania
-
 Luxembourg
-
 Madagascar
-
 Malaysia
-
 Malta
-
 Mauritius
-
 Mexico
-
 Moldova
-
 Mongolia
-
 Montenegro
-
 Morocco
-
 Mozambique
-
 Myanmar
-
 Namibia
-
 Nepal
-
 Netherlands
-
 New Zealand
-
 Nigeria
-
 North Macedonia
-
 Norway
-
 Oman
-
 Pakistan
-
 Palestine
-
 Panama
-
 Papua New Guinea
-
 Paraguay
-
 Peru
-
 Philippines
-
 Poland
-
 Portugal
-
 Puerto Rico
-
 Qatar
-
 Reunion
-
 Romania
-
 Rwanda
-
 Saudi Arabia
-
 Serbia
-
 Singapore
-
 Slovakia
-
 Slovenia
-
 Somalia
-
 South Africa
-
 Spain
-
 Sri Lanka
-
 Sweden
-
 Switzerland
-
 Syria
-
 Taiwan
-
 Tajikistan
-
 Tanzania
-
 Thailand
-
 Trinidad and Tobago
-
 Tunisia
-
 Turkey
-
 UAE
-
 Uganda
-
 Ukraine
-
 United Kingdom
-
United States
-
 Uruguay
-
 Uzbekistan
-
 Venezuela
-
 Vietnam
-
 Yemen
-
 Zambia
-
 Zimbabwe
- Forex
- Crypto












