

Exxon Mobil stock slips while oversold signals point to possible exhaustion among sellers

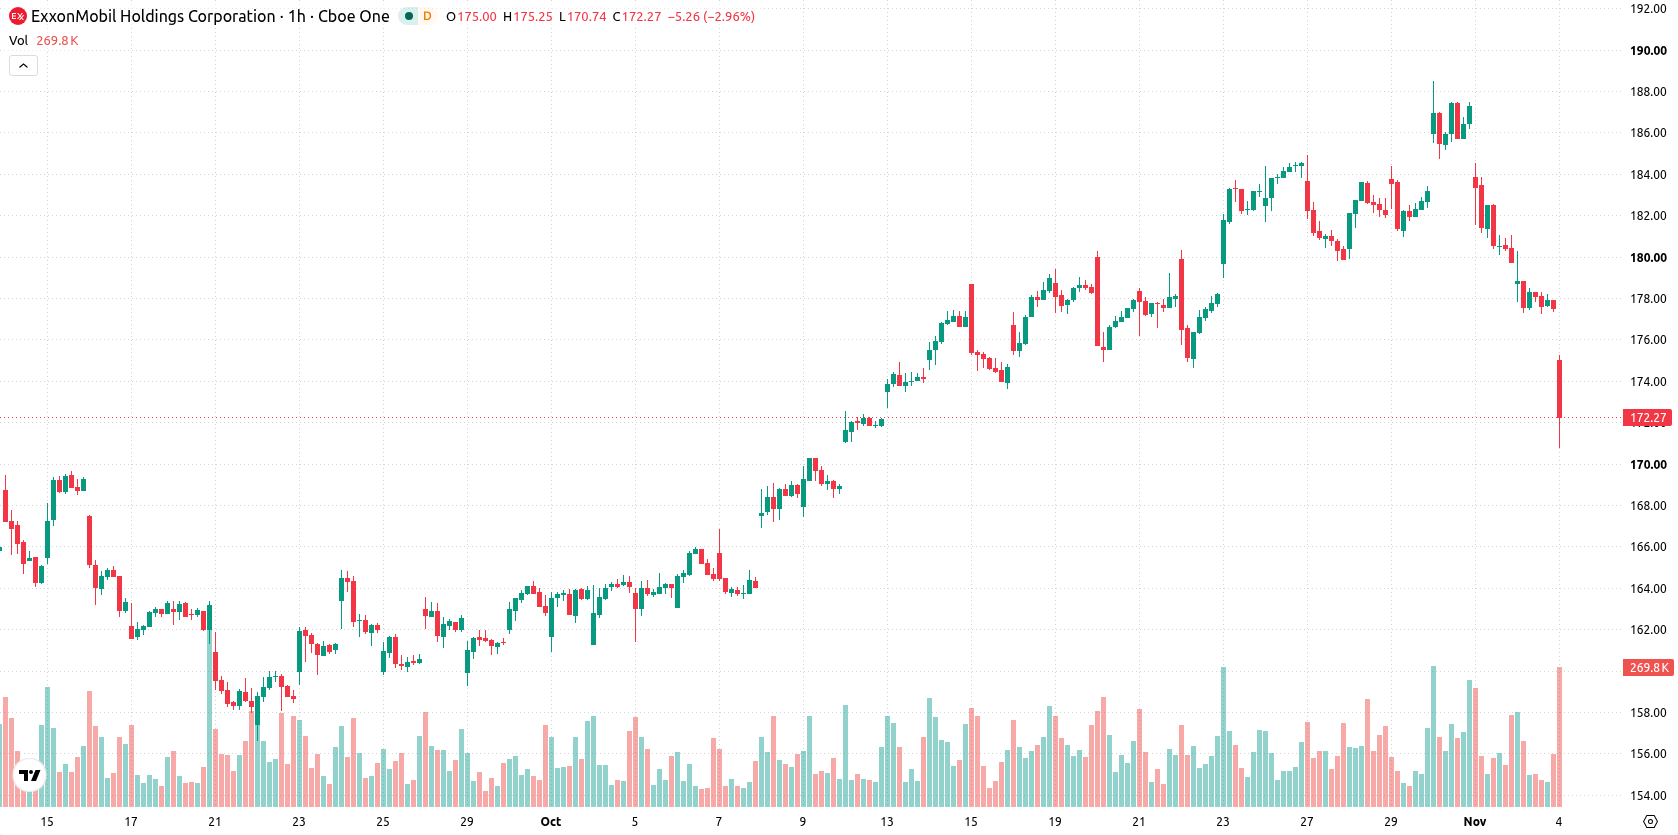
Exxon Mobil (XOM) stock is trading at $172.59, marking a daily drop of 2.74%. The share price is currently below its key short- and medium-term moving averages while remaining above its long-term trend levels.
 173.59
187.90
Highlights
- ExxonMobil raised its quarterly dividend to $1.07 per share, marking 44 consecutive years of increases and delivering higher shareholder returns.
- ExxonMobil expanded its share repurchase authorization to $110 billion through 2027 as management projects sustained free cash flow.
- Shares of ExxonMobil fell 2.74% to $172.59, with technical indicators showing bearish momentum and a projected trading range of $167.8 to $177.61.
Shareholder returns increase as dividend hike and buyback expand
ExxonMobil has raised its quarterly dividend to $1.07 per share, marking its 44th consecutive annual increase and delivering an immediate increase in shareholder returns, according to Defenseworld. This completed action reflects the company's stable cash generation and commitment to distributable income, influencing shareholder demand and longer-term capital allocation decisions. Additionally, ExxonMobil expanded its share repurchase authorization to $110 billion, with the program now extended through 2027, underscoring management's confidence in sustained free cash flow and the capacity for continued capital returns, though price action has remained under broader selling pressure.
Bearish momentum intensifies as short-term signals diverge from uptrend
On the technical side, XOM/USD is positioned below the MA-20 and MA-50 but remains above the MA-200, highlighting a divergence between short-term momentum and the persistent long-term uptrend. The Ichimoku Kijun at $179.6 serves as immediate resistance. MACD and ADX both present a bearish bias, while RSI, Stochastic RSI, and CCI have all moved into validated oversold territories, suggesting exhaustion among sellers. Bull/Bear Power shows intraday dominance by sellers, and the Awesome Oscillator sits at a neutral reading, reinforcing the presence of persistent downside momentum despite oversold signals.
Downside risk persists as volatility bands suggest sideways action
Over the coming days, the forecasted trading range for XOM spans from $167.8 to $177.61, capturing the typical volatility band relative to current levels. With a 42% probability assigned to an upward price move, the risk is tilted toward further downside, though an oversold rebound cannot be ruled out. Should XOM remain within this range, expect sideways trading until a break in either direction occurs. A move above immediate resistance could spark a short-term rebound toward the higher end of the range, while a drop below support could see accelerated declines targeting the lower boundary.
Earlier, analysts noted that Exxon Mobil’s stock was experiencing range-bound trading amid ongoing capital returns and mixed technical signals. Current price action below key moving averages, along with oversold technical readings, highlights the risk of further downside and positions the $167.8 support as a critical level to monitor for potential breakdown.











-
 Afghanistan
-
 Albania
-
 Algeria
-
 Angola
-
 Argentina
-
 Armenia
-
 Australia
-
 Austria
-
 Azerbaijan
-
 Bahamas
-
 Bahrain
-
 Bangladesh
-
 Belarus
-
 Belgium
-
 Bolivia
-
 Botswana
-
 Brazil
-
 Brunei
-
 Bulgaria
-
 Cambodia
-
 Cameroon
-
 Canada
-
 Chile
-
 China
-
 Colombia
-
 Congo
-
 Costa Rica
-
 Cote d'Ivoire
-
 Croatia
-
 Cuba
-
 Cyprus
-
 Czechia
-
 DR Congo
-
 Denmark
-
 Dominican Republic
-
 Ecuador
-
 Egypt
-
 El Salvador
-
 Estonia
-
 Eswatini
-
 Ethiopia
-
 Finland
-
 France
-
 Georgia
-
 Germany
-
 Ghana
-
 Greece
-
 Haiti
-
 Hong Kong
-
 Hungary
-
 India
-
 Indonesia
-
 Iran, Islamic republic
-
 Iraq
-
 Ireland
-
 Israel
-
 Italy
-
 Jamaica
-
 Japan
-
 Jordan
-
 Kazakhstan
-
 Kenya
-
 Korea
-
 Kuwait
-
 Kyrgyzstan
-
 Laos
-
 Latvia
-
 Lebanon
-
 Lesotho
-
 Libya
-
 Lithuania
-
 Luxembourg
-
 Madagascar
-
 Malaysia
-
 Malta
-
 Mauritius
-
 Mexico
-
 Moldova
-
 Mongolia
-
 Montenegro
-
 Morocco
-
 Mozambique
-
 Myanmar
-
 Namibia
-
 Nepal
-
 Netherlands
-
 New Zealand
-
 Nigeria
-
 North Macedonia
-
 Norway
-
 Oman
-
 Pakistan
-
 Palestine
-
 Panama
-
 Papua New Guinea
-
 Paraguay
-
 Peru
-
 Philippines
-
 Poland
-
 Portugal
-
 Puerto Rico
-
 Qatar
-
 Reunion
-
 Romania
-
 Rwanda
-
 Saudi Arabia
-
 Serbia
-
 Singapore
-
 Slovakia
-
 Slovenia
-
 Somalia
-
 South Africa
-
 Spain
-
 Sri Lanka
-
 Sweden
-
 Switzerland
-
 Syria
-
 Taiwan
-
 Tajikistan
-
 Tanzania
-
 Thailand
-
 Trinidad and Tobago
-
 Tunisia
-
 Turkey
-
 UAE
-
 Uganda
-
 Ukraine
-
 United Kingdom
-
United States
-
 Uruguay
-
 Uzbekistan
-
 Venezuela
-
 Vietnam
-
 Yemen
-
 Zambia
-
 Zimbabwe
- Forex
- Crypto












