

National Grid shares technical analysis: Resistance test at GBX1,171 in focus

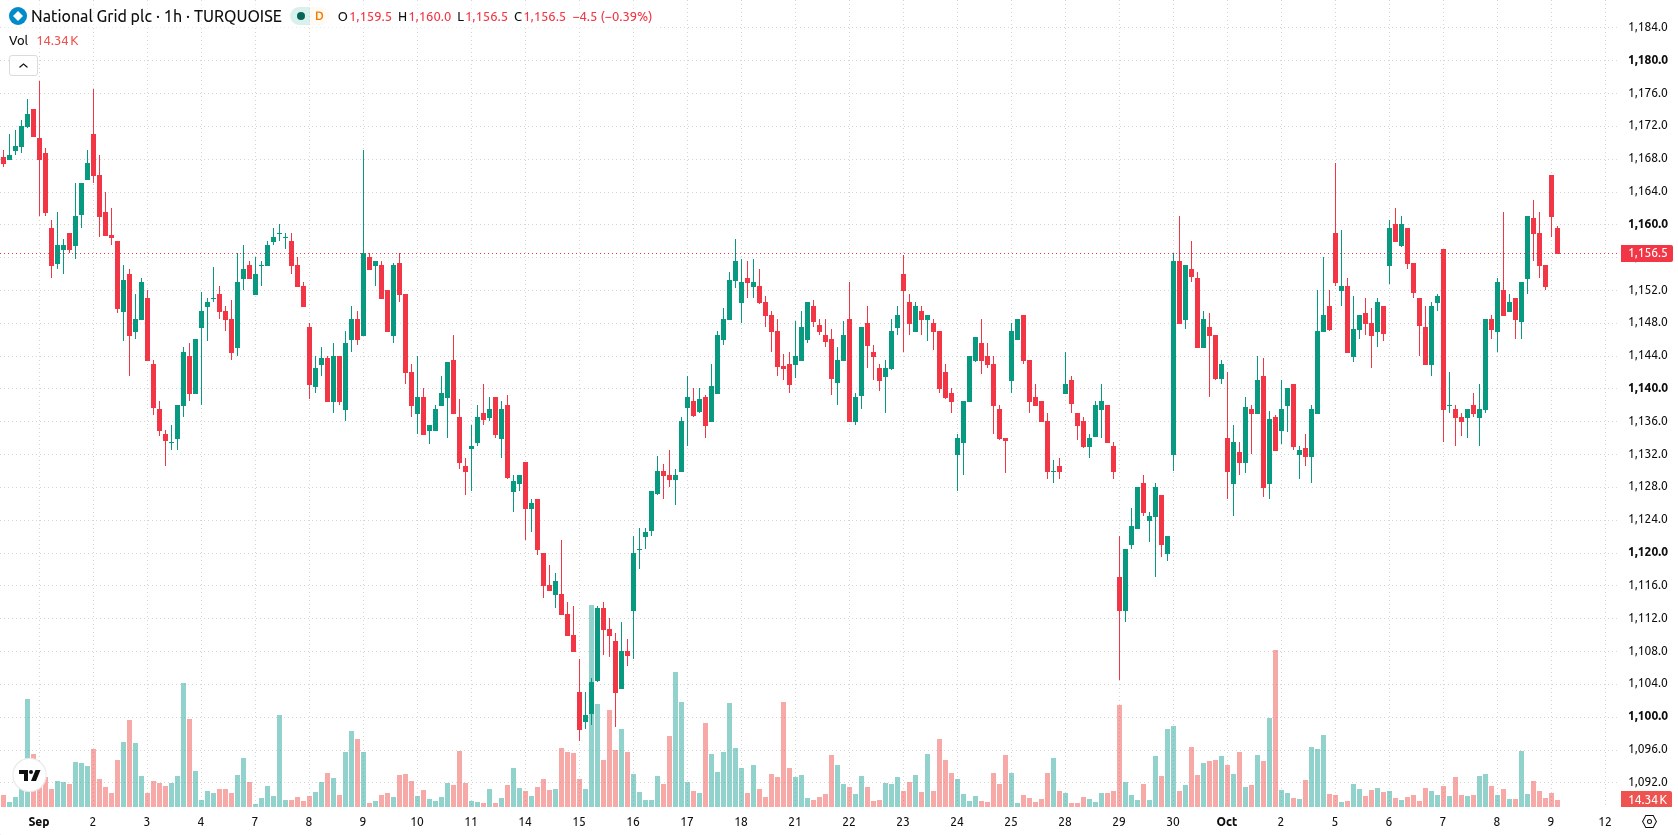
National Grid (NG) stock is trading at GBX1,155, posting a modest daily gain. The stock sits above its key moving averages, reflecting short-term momentum within a subdued session.
 1284.50
Highlights
- Shares trade above short- and medium-term moving averages but remain below the long-term average, indicating a broader bearish trend despite recent bullish momentum.
- Technical indicators are mixed with MACD and RSI showing buyer strength, but several oscillators indicate overbought conditions and stretched intraday momentum.
- Expected price range over the next several sessions is GBX1,140 to GBX1,171, with a very high probability of consolidation or upward movement unless support near GBX1,148 fails.
Intraday overbought readings as technical support holds
On the hourly chart, NG is positioned above the MA-20 at GBX1,147 and MA-50 at GBX1,146, while remaining below the longer-term MA-200 at GBX1,234. The Ichimoku Kijun provides immediate support at GBX1,148. MACD prints a buy signal and Awesome Oscillator is positive, but ADX is neutral, and several intraday oscillators—including RSI at 60.2, Stoch RSI, CCI, and Bull/Bear Power—reflect overbought or buyer-dominated conditions, suggesting stretched intraday momentum amid subdued volatility.
Range-bound outlook as support and resistance levels constrain moves
For the upcoming sessions, NG is expected to consolidate within the GBX1,140–GBX1,171 band, with a very high probability of holding these levels and only a low likelihood of downside breaks. A move above the upper end of the range could point to further upside, whereas loss of support near GBX1,148 or the lower bound could open room for further declines.
Earlier, analysts noted that National Grid shares were under mixed technical signals, with momentum indicators and trend measures lacking clear alignment. The latest data reinforce this view, highlighting the importance of the GBX1,148 support level, where any decisive break could reshape the near-term risk profile.











-
 Afghanistan
-
 Albania
-
 Algeria
-
 Angola
-
 Argentina
-
 Armenia
-
 Australia
-
 Austria
-
 Azerbaijan
-
 Bahamas
-
 Bahrain
-
 Bangladesh
-
 Belarus
-
 Belgium
-
 Bolivia
-
 Botswana
-
 Brazil
-
 Brunei
-
 Bulgaria
-
 Cambodia
-
 Cameroon
-
 Canada
-
 Chile
-
 China
-
 Colombia
-
 Congo
-
 Costa Rica
-
 Cote d'Ivoire
-
 Croatia
-
 Cuba
-
 Cyprus
-
 Czechia
-
 DR Congo
-
 Denmark
-
 Dominican Republic
-
 Ecuador
-
 Egypt
-
 El Salvador
-
 Estonia
-
 Eswatini
-
 Ethiopia
-
 Finland
-
 France
-
 Georgia
-
 Germany
-
 Ghana
-
 Greece
-
 Haiti
-
 Hong Kong
-
 Hungary
-
 India
-
 Indonesia
-
 Iran, Islamic republic
-
 Iraq
-
 Ireland
-
 Israel
-
 Italy
-
 Jamaica
-
 Japan
-
 Jordan
-
 Kazakhstan
-
 Kenya
-
 Korea
-
 Kuwait
-
 Kyrgyzstan
-
 Laos
-
 Latvia
-
 Lebanon
-
 Lesotho
-
 Libya
-
 Lithuania
-
 Luxembourg
-
 Madagascar
-
 Malaysia
-
 Malta
-
 Mauritius
-
 Mexico
-
 Moldova
-
 Mongolia
-
 Montenegro
-
 Morocco
-
 Mozambique
-
 Myanmar
-
 Namibia
-
 Nepal
-
 Netherlands
-
 New Zealand
-
 Nigeria
-
 North Macedonia
-
 Norway
-
 Oman
-
 Pakistan
-
 Palestine
-
 Panama
-
 Papua New Guinea
-
 Paraguay
-
 Peru
-
 Philippines
-
 Poland
-
 Portugal
-
 Puerto Rico
-
 Qatar
-
 Reunion
-
 Romania
-
 Rwanda
-
 Saudi Arabia
-
 Serbia
-
 Singapore
-
 Slovakia
-
 Slovenia
-
 Somalia
-
 South Africa
-
 Spain
-
 Sri Lanka
-
 Sweden
-
 Switzerland
-
 Syria
-
 Taiwan
-
 Tajikistan
-
 Tanzania
-
 Thailand
-
 Trinidad and Tobago
-
 Tunisia
-
 Turkey
-
 UAE
-
 Uganda
-
 Ukraine
-
 United Kingdom
-
United States
-
 Uruguay
-
 Uzbekistan
-
 Venezuela
-
 Vietnam
-
 Yemen
-
 Zambia
-
 Zimbabwe
- Forex
- Crypto












