

Why is Reckitt Benckiser stock steady today? Resistance levels in focus

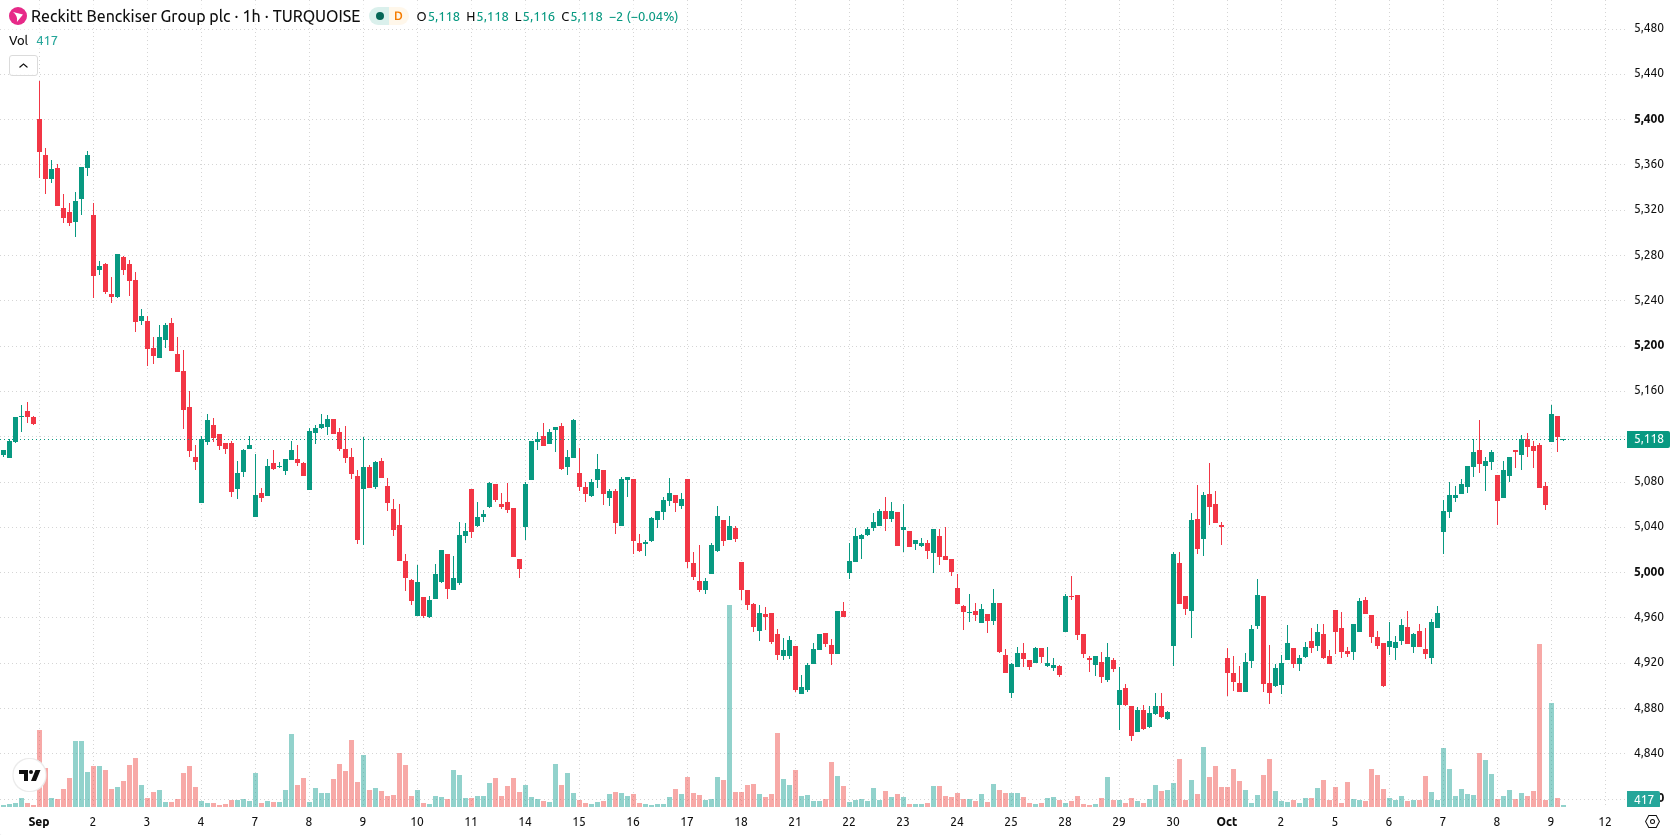
Reckitt Benckiser (RKT) stock is trading at GBX5,118, up marginally on the day. The price is currently above its key short- and medium-term moving averages, but remains capped below longer-term resistance.
 5590.00
5748.00
Highlights
- RKT/GBX is in a short- and medium-term uptrend but faces long-term resistance, trading below the 200-day moving average.
- Momentum indicators show a strong bullish bias overall, though overbought conditions and some neutral signals point to potential consolidation.
- Over the next 2 to 3 trading days, RKT/GBX is projected to trade within the GBX5,013 to GBX5,222 range with a very high probability of holding current levels.
Bullish momentum tempers with overbought signals and neutral oscillators
On the hourly chart, RKT is above both the MA-20 at GBX5,092 and the MA-50 at GBX4,998, while the daily chart places it below the MA-200 at GBX5,275. The Ichimoku Kijun line at GBX5,031 serves as immediate support. Momentum indicators reflect a strong underlying bullish bias, with MACD signaling Strong Buy and ADX also indicating Buy. RSI registers 58.92 (Buy), with CCI and Bull/Bear Power both in overbought territory, pointing to buyer dominance. However, Stoch RSI and the Awesome Oscillator are neutral, highlighting a potential pause as the mix of overbought conditions and neutral signals creates a modest divergence, warranting some caution.
Consolidation favored while volatility bands limit directional risk
In the next two to three trading days, RKT is expected to trade within a volatility band between GBX5,013 and GBX5,222. The baseline scenario projects sideways consolidation near current levels. A bullish breakout above resistance would signal scope for further gains, while a move below immediate support at GBX5,031 could trigger short-term weakness.
Earlier, analysts noted that Reckitt Benckiser's operational streamlining and shareholder initiatives were expected to support price stability amid mixed technical signals. The current analysis reinforces this outlook, with momentum indicators now suggesting that consolidation is likely, and traders should monitor for a decisive move above GBX5,222 or below GBX5,031 as the next directional catalyst.










-
 Afghanistan
-
 Albania
-
 Algeria
-
 Angola
-
 Argentina
-
 Armenia
-
 Australia
-
 Austria
-
 Azerbaijan
-
 Bahamas
-
 Bahrain
-
 Bangladesh
-
 Belarus
-
 Belgium
-
 Bolivia
-
 Botswana
-
 Brazil
-
 Brunei
-
 Bulgaria
-
 Cambodia
-
 Cameroon
-
 Canada
-
 Chile
-
 China
-
 Colombia
-
 Congo
-
 Costa Rica
-
 Cote d'Ivoire
-
 Croatia
-
 Cuba
-
 Cyprus
-
 Czechia
-
 DR Congo
-
 Denmark
-
 Dominican Republic
-
 Ecuador
-
 Egypt
-
 El Salvador
-
 Estonia
-
 Eswatini
-
 Ethiopia
-
 Finland
-
 France
-
 Georgia
-
 Germany
-
 Ghana
-
 Greece
-
 Haiti
-
 Hong Kong
-
 Hungary
-
 India
-
 Indonesia
-
 Iran, Islamic republic
-
 Iraq
-
 Ireland
-
 Israel
-
 Italy
-
 Jamaica
-
 Japan
-
 Jordan
-
 Kazakhstan
-
 Kenya
-
 Korea
-
 Kuwait
-
 Kyrgyzstan
-
 Laos
-
 Latvia
-
 Lebanon
-
 Lesotho
-
 Libya
-
 Lithuania
-
 Luxembourg
-
 Madagascar
-
 Malaysia
-
 Malta
-
 Mauritius
-
 Mexico
-
 Moldova
-
 Mongolia
-
 Montenegro
-
 Morocco
-
 Mozambique
-
 Myanmar
-
 Namibia
-
 Nepal
-
 Netherlands
-
 New Zealand
-
 Nigeria
-
 North Macedonia
-
 Norway
-
 Oman
-
 Pakistan
-
 Palestine
-
 Panama
-
 Papua New Guinea
-
 Paraguay
-
 Peru
-
 Philippines
-
 Poland
-
 Portugal
-
 Puerto Rico
-
 Qatar
-
 Reunion
-
 Romania
-
 Rwanda
-
 Saudi Arabia
-
 Serbia
-
 Singapore
-
 Slovakia
-
 Slovenia
-
 Somalia
-
 South Africa
-
 Spain
-
 Sri Lanka
-
 Sweden
-
 Switzerland
-
 Syria
-
 Taiwan
-
 Tajikistan
-
 Tanzania
-
 Thailand
-
 Trinidad and Tobago
-
 Tunisia
-
 Turkey
-
 UAE
-
 Uganda
-
 Ukraine
-
 United Kingdom
-
United States
-
 Uruguay
-
 Uzbekistan
-
 Venezuela
-
 Vietnam
-
 Yemen
-
 Zambia
-
 Zimbabwe
- Forex
- Crypto












