

Why is AstraZeneca stock up today? Summit $2B funding and GBX12,030 resistance test

AstraZeneca (AZN) stock is trading at GBX12,024, reflecting a daily rise of 1.11%. The current price is situated below its key moving averages on short-term timeframes and has yet to recover above longer-term averages.
 12112.00
12180.00
12112.00
12180.00
Highlights
- AstraZeneca reported that its Phase III HICKORY trial for efzimfotase alfa in hypophosphatasia did not reach statistical significance for the main endpoint, raising pipeline growth questions.
- AstraZeneca maintains a 1.93% dividend yield with a low 16% payout ratio, supporting a stable income profile as the company secures major new collaborations and funding.
- Shares of AstraZeneca trade below key moving averages, with technical signals mixed and a projected range of GBX11,816 to GBX12,231 dominated by bearish long-term pressure and likely consolidation.
Pipeline uncertainties as trial miss offsets income stability and partnerships
The main corporate event shaping sentiment is the October 11, 2026 disclosure of Phase III HICKORY trial results for efzimfotase alfa (ALXN1850), with AstraZeneca's treatment not achieving statistical significance on the Six-Minute Walk Test in hypophosphatasia, though promising secondary endpoint trends were noted, according to Gurufocus. While this created near-term questions for pipeline growth, AstraZeneca continues to provide a stable income profile, as highlighted by its 1.93% dividend yield and low 16% payout ratio, also cited by Gurufocus. Additionally, recent collaborations, such as Carterra's partnership with AstraZeneca in AI-driven drug discovery and Summit's $2 billion funding from AstraZeneca (Bizjournals), illustrate ongoing longer-term growth initiatives beyond the clinical dataset.
Buyer strength persists despite technical resistance and mixed momentum signals
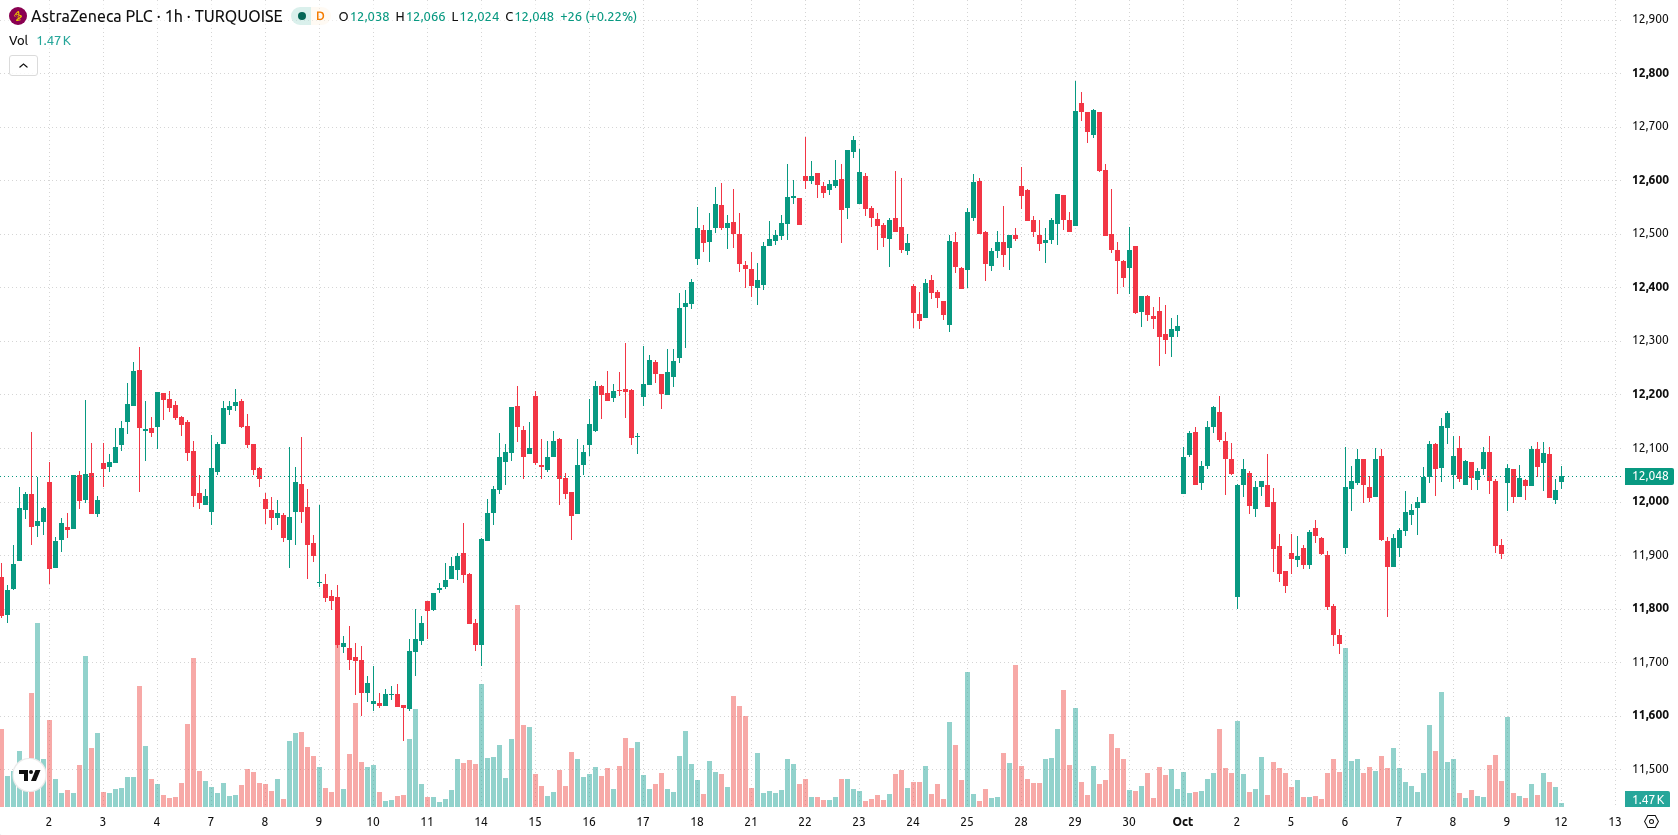
On the H1 chart, AZN is trading below the MA-20 at GBX12,050, but remains above the MA-50 at GBX11,991; it is still far below the MA-200 on the daily timeframe (GBX13,518). The Ichimoku Kijun sits at GBX12,030 and acts as immediate resistance. Momentum indicators present a complex picture: MACD signals strong buying, ADX is neutral, RSI stands at 49.18 with CCI pointing to mild selling pressure, and Stochastic RSI is also neutral. Bull/Bear Power indicates overbought conditions, suggesting recent buyer dominance despite the session closing near its low.
Downside favored with range-bound action and low bullish odds
In the short term, AZN is expected to consolidate within the GBX11,816 to GBX12,231 range, which defines the asset's typical volatility band relative to current levels. Upward price movement carries a low probability of 22%; a bullish scenario would require a break above the Ichimoku Kijun resistance. If support at the lower bound fails, a downward scenario could unfold, making downside risk the more likely outcome in coming sessions.
Earlier, analysts noted that AstraZeneca’s shares were exhibiting rangebound price action under sustained selling pressure, with technical indicators remaining mixed despite ongoing product and pipeline developments. The latest clinical trial update and partnership news add both near-term uncertainty and long-term growth drivers, but continued consolidation below key resistance underscores that downside risk remains the prevailing scenario to monitor.





Latest AstraZeneca News





-
 Afghanistan
-
 Albania
-
 Algeria
-
 Angola
-
 Argentina
-
 Armenia
-
 Australia
-
 Austria
-
 Azerbaijan
-
 Bahamas
-
 Bahrain
-
 Bangladesh
-
 Belarus
-
 Belgium
-
 Bolivia
-
 Botswana
-
 Brazil
-
 Brunei
-
 Bulgaria
-
 Cambodia
-
 Cameroon
-
 Canada
-
 Chile
Chile
-
 China
China
-
 Colombia
-
 Congo
Congo
-
 Costa Rica
-
 Cote d'Ivoire
-
 Croatia
-
 Cuba
Cuba
-
 Cyprus
-
 Czechia
-
 DR Congo
-
 Denmark
-
 Dominican Republic
-
 Ecuador
-
 Egypt
Egypt
-
 El Salvador
-
 Estonia
-
 Eswatini
-
 Ethiopia
-
 Finland
-
 France
-
 Georgia
-
 Germany
-
 Ghana
Ghana
-
 Greece
-
 Haiti
Haiti
-
 Hong Kong
-
 Hungary
-
 India
India
-
 Indonesia
-
 Iran, Islamic republic
-
 Iraq
Iraq
-
 Ireland
-
 Israel
-
 Italy
Italy
-
 Jamaica
-
 Japan
Japan
-
 Jordan
-
 Kazakhstan
-
 Kenya
Kenya
-
 Korea
Korea
-
 Kuwait
-
 Kyrgyzstan
-
 Laos
Laos
-
 Latvia
-
 Lebanon
-
 Lesotho
-
 Libya
Libya
-
 Lithuania
-
 Luxembourg
-
 Madagascar
-
 Malaysia
-
 Malta
Malta
-
 Mauritius
-
 Mexico
-
 Moldova
-
 Mongolia
-
 Montenegro
-
 Morocco
-
 Mozambique
-
 Myanmar
-
 Namibia
-
 Nepal
Nepal
-
 Netherlands
-
 New Zealand
-
 Nigeria
-
 North Macedonia
-
 Norway
-
 Oman
Oman
-
 Pakistan
-
 Palestine
-
 Panama
-
 Papua New Guinea
-
 Paraguay
-
 Peru
Peru
-
 Philippines
-
 Poland
-
 Portugal
-
 Puerto Rico
-
 Qatar
Qatar
-
 Reunion
-
 Romania
-
 Rwanda
-
 Saudi Arabia
-
 Serbia
-
 Singapore
-
 Slovakia
-
 Slovenia
-
 Somalia
-
 South Africa
-
 Spain
Spain
-
 Sri Lanka
-
 Sweden
-
 Switzerland
-
 Syria
Syria
-
 Taiwan
-
 Tajikistan
-
 Tanzania
-
 Thailand
-
 Trinidad and Tobago
-
 Tunisia
-
 Turkey
-
 UAE
UAE
-
 Uganda
-
 Ukraine
-
 United Kingdom
-
United States
-
 Uruguay
-
 Uzbekistan
-
 Venezuela
-
 Vietnam
-
 Yemen
Yemen
-
 Zambia
-
 Zimbabwe
- Forex
- Crypto












