

Vodafone stock falls amid seller pressure and weak intraday momentum

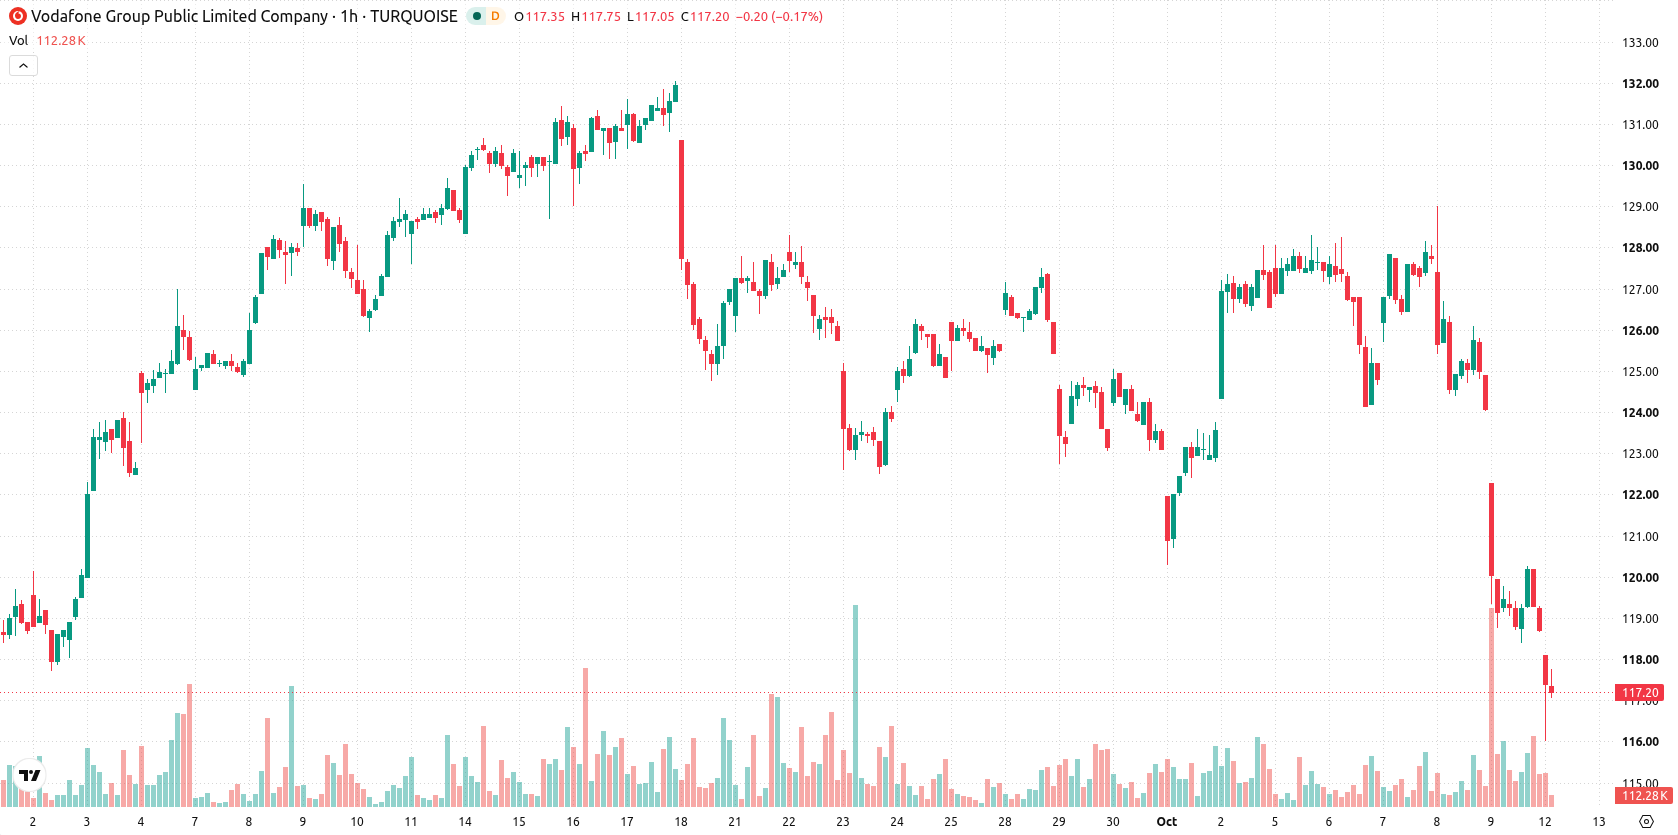
Vodafone (VOD) stock is trading at GBX116.9, marking a decline of 1.52% today. The share price currently sits below its key short- and medium-term moving averages, though it remains above its longer-term trend support.
 118.22
128.60
118.22
128.60
Highlights
- Vodafone stock closed at GBX116.9, down 1.52% with a moderate gap down and persistent seller pressure.
- Price remains below short- and medium-term moving averages indicating bearish short-term momentum, while long-term support is still intact.
- Technical indicators are predominantly bearish and oversold, with price expected to trade between GBX112.34 and GBX121.46 over the next 2 to 3 days.
Bearish momentum deepens with intraday price stuck below resistance
On the technical front, VOD trades below its MA-20 and MA-50 on the H1 timeframe, indicating short- to medium-term trend weakness. However, the price remains above the MA-200 on the daily chart, with the Ichimoku Kijun level at GBX122.98 acting as immediate resistance. Momentum indicators such as MACD and ADX continue to point toward a bearish bias on the H1 chart. RSI, Stoch RSI, CCI, and Bull/Bear Power all register strongly oversold or sell readings intraday, highlighting persistent selling dominance, while the Awesome Oscillator stays neutral without validating the prevailing trend direction.
Consolidation likely as volatility persists and breakout hopes dim
Over the next two to three sessions, VOD is expected to move within a volatility band between GBX112.34 and GBX121.46, given the ongoing market dynamics. A recovery above GBX122.98 would be necessary for any bullish scenario to develop, which currently appears unlikely. Failure to hold above the support at GBX112.34 could trigger renewed selling, while the baseline scenario involves a period of consolidation as volatility persists.
Previously it was reported that Vodafone and other telecom stocks lagged after sector-specific developments weighed on performance despite broader market improvements. Current technical signals now underscore the importance of the GBX112.34 support level as a potential trigger for renewed downside, making it a key threshold for traders to monitor in the days ahead.





Latest Vodafone News





-
 Afghanistan
-
 Albania
-
 Algeria
-
 Angola
-
 Argentina
-
 Armenia
-
 Australia
-
 Austria
-
 Azerbaijan
-
 Bahamas
-
 Bahrain
-
 Bangladesh
-
 Belarus
-
 Belgium
-
 Bolivia
-
 Botswana
-
 Brazil
-
 Brunei
-
 Bulgaria
-
 Cambodia
-
 Cameroon
-
 Canada
-
 Chile
Chile
-
 China
China
-
 Colombia
-
 Congo
Congo
-
 Costa Rica
-
 Cote d'Ivoire
-
 Croatia
-
 Cuba
Cuba
-
 Cyprus
-
 Czechia
-
 DR Congo
-
 Denmark
-
 Dominican Republic
-
 Ecuador
-
 Egypt
Egypt
-
 El Salvador
-
 Estonia
-
 Eswatini
-
 Ethiopia
-
 Finland
-
 France
-
 Georgia
-
 Germany
-
 Ghana
Ghana
-
 Greece
-
 Haiti
Haiti
-
 Hong Kong
-
 Hungary
-
 India
India
-
 Indonesia
-
 Iran, Islamic republic
-
 Iraq
Iraq
-
 Ireland
-
 Israel
-
 Italy
Italy
-
 Jamaica
-
 Japan
Japan
-
 Jordan
-
 Kazakhstan
-
 Kenya
Kenya
-
 Korea
Korea
-
 Kuwait
-
 Kyrgyzstan
-
 Laos
Laos
-
 Latvia
-
 Lebanon
-
 Lesotho
-
 Libya
Libya
-
 Lithuania
-
 Luxembourg
-
 Madagascar
-
 Malaysia
-
 Malta
Malta
-
 Mauritius
-
 Mexico
-
 Moldova
-
 Mongolia
-
 Montenegro
-
 Morocco
-
 Mozambique
-
 Myanmar
-
 Namibia
-
 Nepal
Nepal
-
 Netherlands
-
 New Zealand
-
 Nigeria
-
 North Macedonia
-
 Norway
-
 Oman
Oman
-
 Pakistan
-
 Palestine
-
 Panama
-
 Papua New Guinea
-
 Paraguay
-
 Peru
Peru
-
 Philippines
-
 Poland
-
 Portugal
-
 Puerto Rico
-
 Qatar
Qatar
-
 Reunion
-
 Romania
-
 Rwanda
-
 Saudi Arabia
-
 Serbia
-
 Singapore
-
 Slovakia
-
 Slovenia
-
 Somalia
-
 South Africa
-
 Spain
Spain
-
 Sri Lanka
-
 Sweden
-
 Switzerland
-
 Syria
Syria
-
 Taiwan
-
 Tajikistan
-
 Tanzania
-
 Thailand
-
 Trinidad and Tobago
-
 Tunisia
-
 Turkey
-
 UAE
UAE
-
 Uganda
-
 Ukraine
-
 United Kingdom
-
United States
-
 Uruguay
-
 Uzbekistan
-
 Venezuela
-
 Vietnam
-
 Yemen
Yemen
-
 Zambia
-
 Zimbabwe
- Forex
- Crypto












