

Aviva shares technical analysis: Buyers maintain momentum but resistance at GBX693.57 limits upside

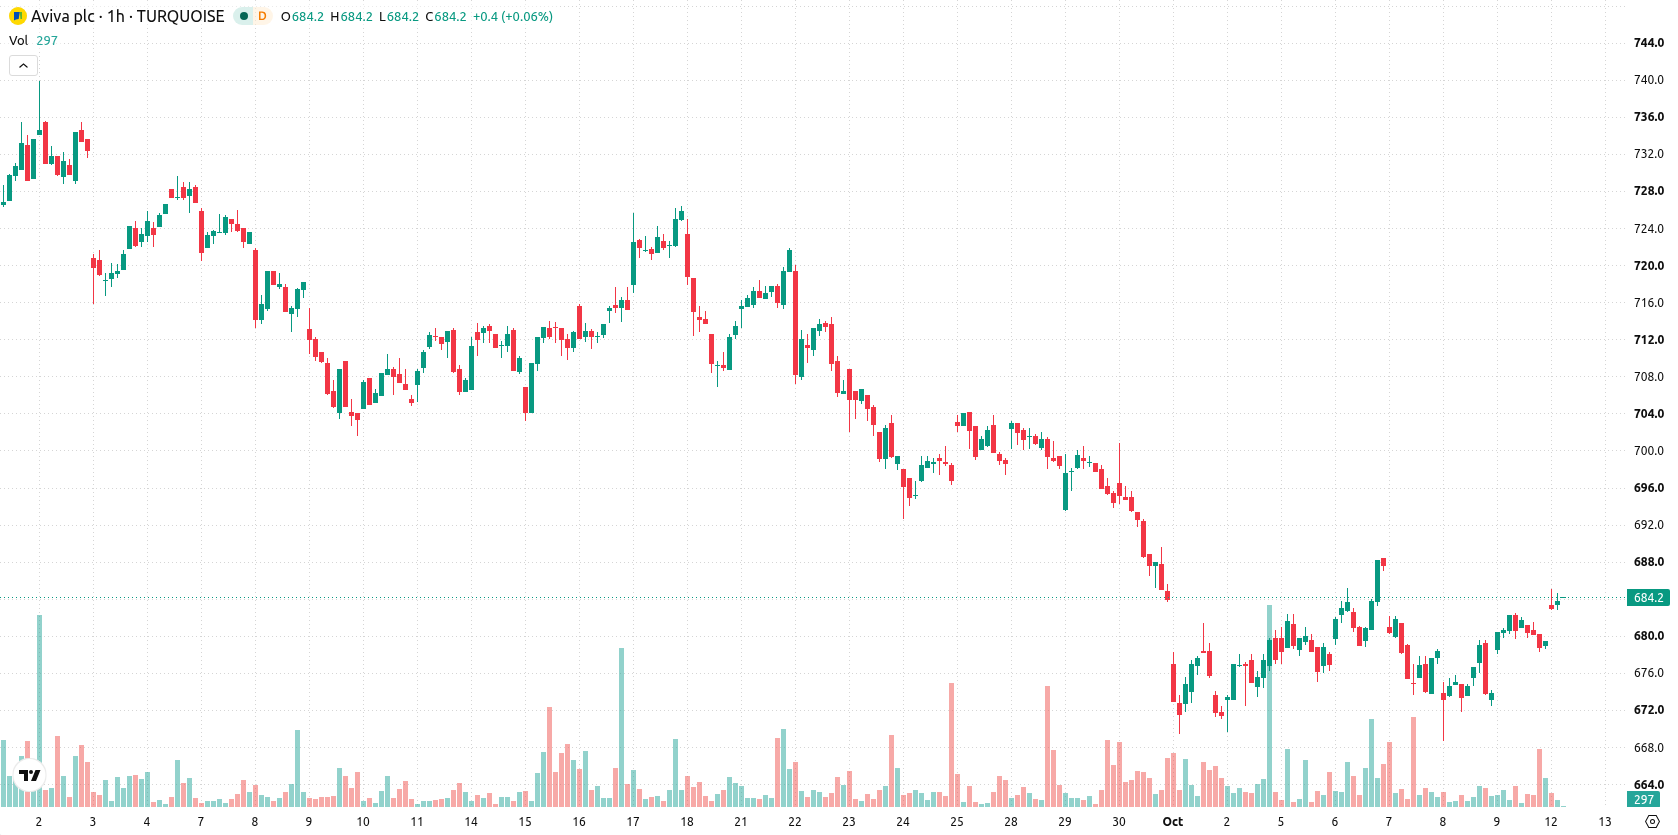
Aviva (AV) stock is trading at GBX684.8 after a modest rise for the session. The price remains positioned above its key moving averages, reflecting steady upward momentum.
 685.00
688.20
685.00
688.20
Highlights
- Aviva stock offers a 6.1% dividend yield, attracting buyers seeking income exposure over other market alternatives.
- The elevated payout continues to support demand among shareholders during periods of limited price movement.
- Shares of Aviva trade above key moving averages with bullish momentum; expected range for the next several days is GBX676.03 to GBX693.57.
Dividend yield drives demand as investors seek income stability
Aviva's current dividend yield of 6.1% stands out as a primary factor for investor interest, providing an attractive income stream relative to broader market alternatives. This elevated payout may stimulate additional demand among income-oriented shareholders and reinforce the company's appeal during periods of muted price action. The robust yield continues to influence market positioning for the stock.
Bullish bias holds as overbought signals temper momentum outlook
On the hourly chart, AV is trading above the MA-20 of GBX678.34 and the MA-50 of GBX679.18, with the long-term MA-200 below at GBX659.26. Immediate support is identified at the Ichimoku Kijun level of GBX676.9. The MACD signals a buy, while the ADX remains neutral. RSI is at 57.29, in buy territory, but Stochastic RSI, CCI, and Bull/Bear Power all point to overbought conditions, suggesting that buyers control momentum for now. The Awesome Oscillator also reflects bullish momentum, though mixed signals from oscillators indicate a possible pace of exhaustion intraday.
Sideways trade likely as breakout hinges on resistance breach
Looking ahead, AV is expected to consolidate within a volatility band between GBX676.03 and GBX693.57 over the next several days. The probability of a further breakout to the upside is 60%, while there is a 40% chance of a pullback toward support. The base scenario favors range-bound action unless AV decisively clears resistance or drops below immediate support.
Earlier, analysts noted that Aviva stock was likely to consolidate after a period of persistent buyer dominance that left technical indicators overextended. The latest data reinforce this consolidation scenario, with the elevated dividend yield now playing a greater role in market positioning and suggesting that movements beyond the current volatility band may depend on a decisive shift in either momentum or yield expectations.










-
 Afghanistan
-
 Albania
-
 Algeria
-
 Angola
-
 Argentina
-
 Armenia
-
 Australia
-
 Austria
-
 Azerbaijan
-
 Bahamas
-
 Bahrain
-
 Bangladesh
-
 Belarus
-
 Belgium
-
 Bolivia
-
 Botswana
-
 Brazil
-
 Brunei
-
 Bulgaria
-
 Cambodia
-
 Cameroon
-
 Canada
-
 Chile
Chile
-
 China
China
-
 Colombia
-
 Congo
Congo
-
 Costa Rica
-
 Cote d'Ivoire
-
 Croatia
-
 Cuba
Cuba
-
 Cyprus
-
 Czechia
-
 DR Congo
-
 Denmark
-
 Dominican Republic
-
 Ecuador
-
 Egypt
Egypt
-
 El Salvador
-
 Estonia
-
 Eswatini
-
 Ethiopia
-
 Finland
-
 France
-
 Georgia
-
 Germany
-
 Ghana
Ghana
-
 Greece
-
 Haiti
Haiti
-
 Hong Kong
-
 Hungary
-
 India
India
-
 Indonesia
-
 Iran, Islamic republic
-
 Iraq
Iraq
-
 Ireland
-
 Israel
-
 Italy
Italy
-
 Jamaica
-
 Japan
Japan
-
 Jordan
-
 Kazakhstan
-
 Kenya
Kenya
-
 Korea
Korea
-
 Kuwait
-
 Kyrgyzstan
-
 Laos
Laos
-
 Latvia
-
 Lebanon
-
 Lesotho
-
 Libya
Libya
-
 Lithuania
-
 Luxembourg
-
 Madagascar
-
 Malaysia
-
 Malta
Malta
-
 Mauritius
-
 Mexico
-
 Moldova
-
 Mongolia
-
 Montenegro
-
 Morocco
-
 Mozambique
-
 Myanmar
-
 Namibia
-
 Nepal
Nepal
-
 Netherlands
-
 New Zealand
-
 Nigeria
-
 North Macedonia
-
 Norway
-
 Oman
Oman
-
 Pakistan
-
 Palestine
-
 Panama
-
 Papua New Guinea
-
 Paraguay
-
 Peru
Peru
-
 Philippines
-
 Poland
-
 Portugal
-
 Puerto Rico
-
 Qatar
Qatar
-
 Reunion
-
 Romania
-
 Rwanda
-
 Saudi Arabia
-
 Serbia
-
 Singapore
-
 Slovakia
-
 Slovenia
-
 Somalia
-
 South Africa
-
 Spain
Spain
-
 Sri Lanka
-
 Sweden
-
 Switzerland
-
 Syria
Syria
-
 Taiwan
-
 Tajikistan
-
 Tanzania
-
 Thailand
-
 Trinidad and Tobago
-
 Tunisia
-
 Turkey
-
 UAE
UAE
-
 Uganda
-
 Ukraine
-
 United Kingdom
-
United States
-
 Uruguay
-
 Uzbekistan
-
 Venezuela
-
 Vietnam
-
 Yemen
Yemen
-
 Zambia
-
 Zimbabwe
- Forex
- Crypto












