

BT Group stock outlook: Downward momentum persists with limited upside seen

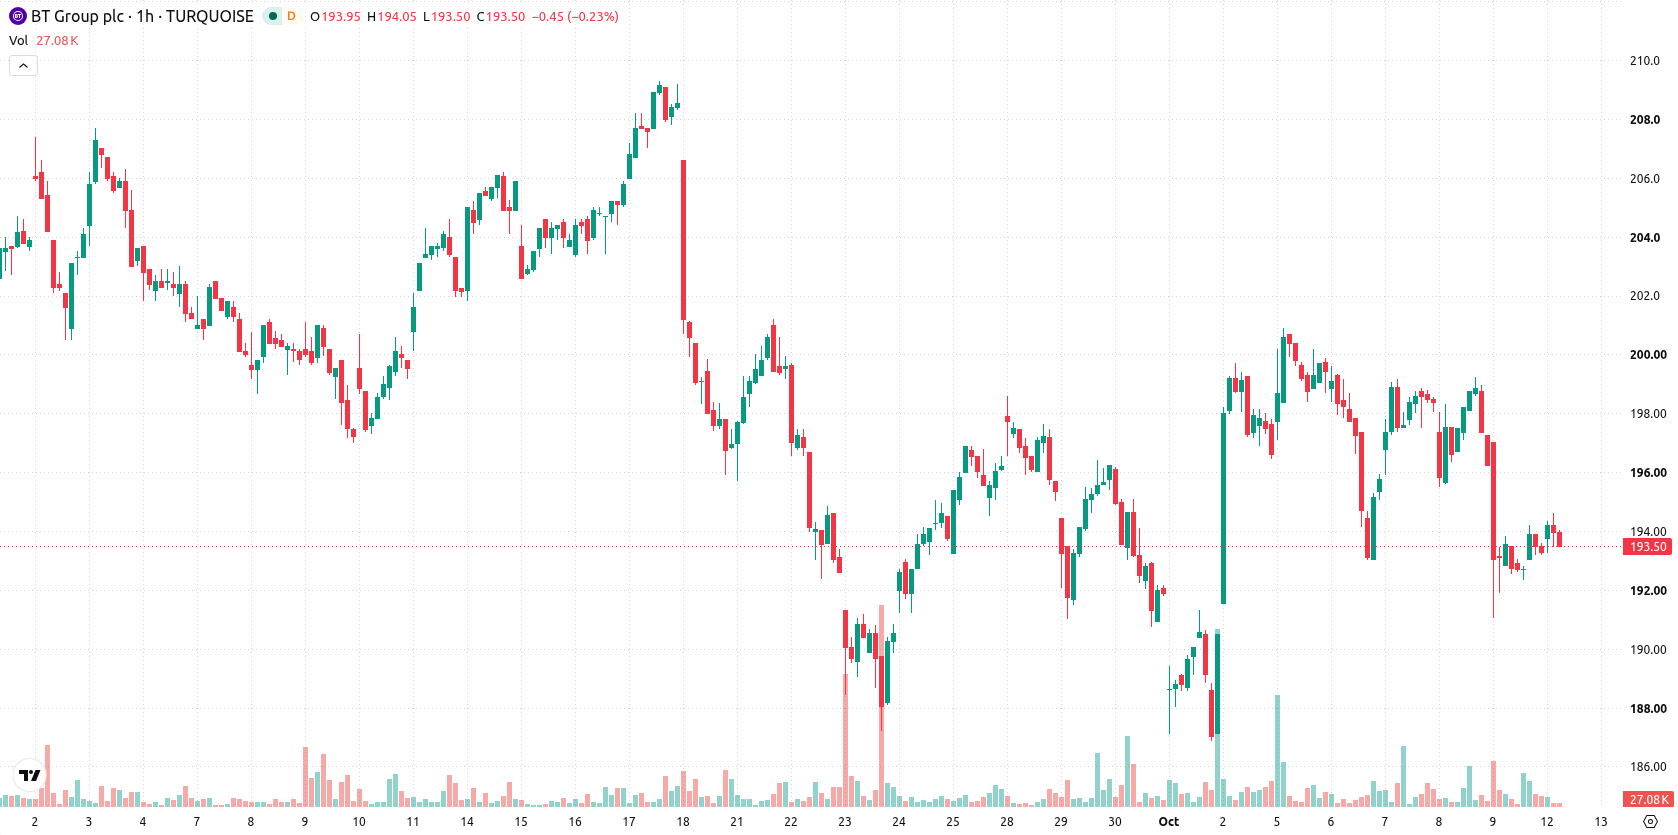
BT Group (BT-A) stock is trading at GBX193.3, down 2.1% on the day. Shares remain below their main moving averages, indicating ongoing pressure relative to recent trends.
 196.35
201.00
196.35
201.00
Highlights
- Shares of BT Group closed at GBX193.3 after declining 2.1% in the session with moderate volatility.
- BT Group stock continues to trade below key short- and long-term moving averages, with negative momentum across most indicators.
- The forecast range for the next few sessions is GBX188.67 to GBX197.93, with a high probability of further downside.
Strong intraday selling as technicals confirm multi-timeframe weakness
BT-A is trading below the MA-20 at GBX195.63 and the MA-50 at GBX197.05, with longer-term pressure confirmed by price also holding below the MA-200 at GBX202.89. Immediate resistance is set at the Ichimoku Kijun level of GBX194.97. Among indicators, MACD currently signals Sell, ADX is Neutral, RSI stands at 40 (Sell), and CCI also signals Sell. The Stochastic RSI is Neutral, while Bull/Bear Power indicates the market is in oversold territory, highlighting strong intraday selling pressure.
Elevated downside risk as rangebound trading dominates outlook
In the short term, BT-A is likely to remain rangebound, with expected movement between GBX188.67 and GBX197.93. The probability of a sustained upward move is assessed as very low, while the likelihood of a further decline is high. Continued sideways trading within this volatility band appears most probable unless price reclaims immediate resistance at the Kijun, which would be needed for a bullish scenario. A decisive drop below range support would reinforce the bearish outlook toward the lower boundary.
Earlier, analysts noted that telecom stocks including BT Group lagged the wider UK equity indices following sector-specific challenges and competitive pressures. With BT-A continuing to exhibit technical weakness and heightened downside risk, traders should monitor for any breach of the GBX188.67 support to gauge the next potential move.





Latest BT Group News





-
 Afghanistan
-
 Albania
-
 Algeria
-
 Angola
-
 Argentina
-
 Armenia
-
 Australia
-
 Austria
-
 Azerbaijan
-
 Bahamas
-
 Bahrain
-
 Bangladesh
-
 Belarus
-
 Belgium
-
 Bolivia
-
 Botswana
-
 Brazil
-
 Brunei
-
 Bulgaria
-
 Cambodia
-
 Cameroon
-
 Canada
-
 Chile
Chile
-
 China
China
-
 Colombia
-
 Congo
Congo
-
 Costa Rica
-
 Cote d'Ivoire
-
 Croatia
-
 Cuba
Cuba
-
 Cyprus
-
 Czechia
-
 DR Congo
-
 Denmark
-
 Dominican Republic
-
 Ecuador
-
 Egypt
Egypt
-
 El Salvador
-
 Estonia
-
 Eswatini
-
 Ethiopia
-
 Finland
-
 France
-
 Georgia
-
 Germany
-
 Ghana
Ghana
-
 Greece
-
 Haiti
Haiti
-
 Hong Kong
-
 Hungary
-
 India
India
-
 Indonesia
-
 Iran, Islamic republic
-
 Iraq
Iraq
-
 Ireland
-
 Israel
-
 Italy
Italy
-
 Jamaica
-
 Japan
Japan
-
 Jordan
-
 Kazakhstan
-
 Kenya
Kenya
-
 Korea
Korea
-
 Kuwait
-
 Kyrgyzstan
-
 Laos
Laos
-
 Latvia
-
 Lebanon
-
 Lesotho
-
 Libya
Libya
-
 Lithuania
-
 Luxembourg
-
 Madagascar
-
 Malaysia
-
 Malta
Malta
-
 Mauritius
-
 Mexico
-
 Moldova
-
 Mongolia
-
 Montenegro
-
 Morocco
-
 Mozambique
-
 Myanmar
-
 Namibia
-
 Nepal
Nepal
-
 Netherlands
-
 New Zealand
-
 Nigeria
-
 North Macedonia
-
 Norway
-
 Oman
Oman
-
 Pakistan
-
 Palestine
-
 Panama
-
 Papua New Guinea
-
 Paraguay
-
 Peru
Peru
-
 Philippines
-
 Poland
-
 Portugal
-
 Puerto Rico
-
 Qatar
Qatar
-
 Reunion
-
 Romania
-
 Rwanda
-
 Saudi Arabia
-
 Serbia
-
 Singapore
-
 Slovakia
-
 Slovenia
-
 Somalia
-
 South Africa
-
 Spain
Spain
-
 Sri Lanka
-
 Sweden
-
 Switzerland
-
 Syria
Syria
-
 Taiwan
-
 Tajikistan
-
 Tanzania
-
 Thailand
-
 Trinidad and Tobago
-
 Tunisia
-
 Turkey
-
 UAE
UAE
-
 Uganda
-
 Ukraine
-
 United Kingdom
-
United States
-
 Uruguay
-
 Uzbekistan
-
 Venezuela
-
 Vietnam
-
 Yemen
Yemen
-
 Zambia
-
 Zimbabwe
- Forex
- Crypto












