

Alphabet stock weekly forecast: Positive tone supported by Berkshire stake and Google Cloud growth

Shares of Alphabet Inc. (GOOGL) are trading near $353 as the recovery that started in late September holds, but technical signals suggest the setup is looking stretched. The week ahead will test whether the positive tone, underpinned by recent corporate news, can persist if profit-taking emerges near resistance.
 356.02
355.23
356.02
355.23
Highlights
- Shares of Alphabet edged higher to $353.45 over the past week, trading above key moving averages and maintaining a bullish long-term structure.
- Technical indicators show overbought conditions and consolidation just below resistance, with momentum contained within a narrow range.
- Shares are projected to move between $348.02 and $362.9 over the next five days, with a 77% probability of an increase and a 23% probability of a decrease.
AI controversy and cloud gains drive flows as lawsuits compete with bullish news
Alphabet faced two securities fraud class action lawsuits, including one tied to disclosed AI issues that drew regulatory attention, according to PR Newswire. At the same time, Google Cloud's reported 82% revenue growth and Berkshire Hathaway's new stake in GOOGL contributed to improving sentiment, with ETF flows totaling $48.4 million as per GuruFocus. Ongoing investments in AI and a funding push by Isomorphic Labs are set to remain in focus this week.
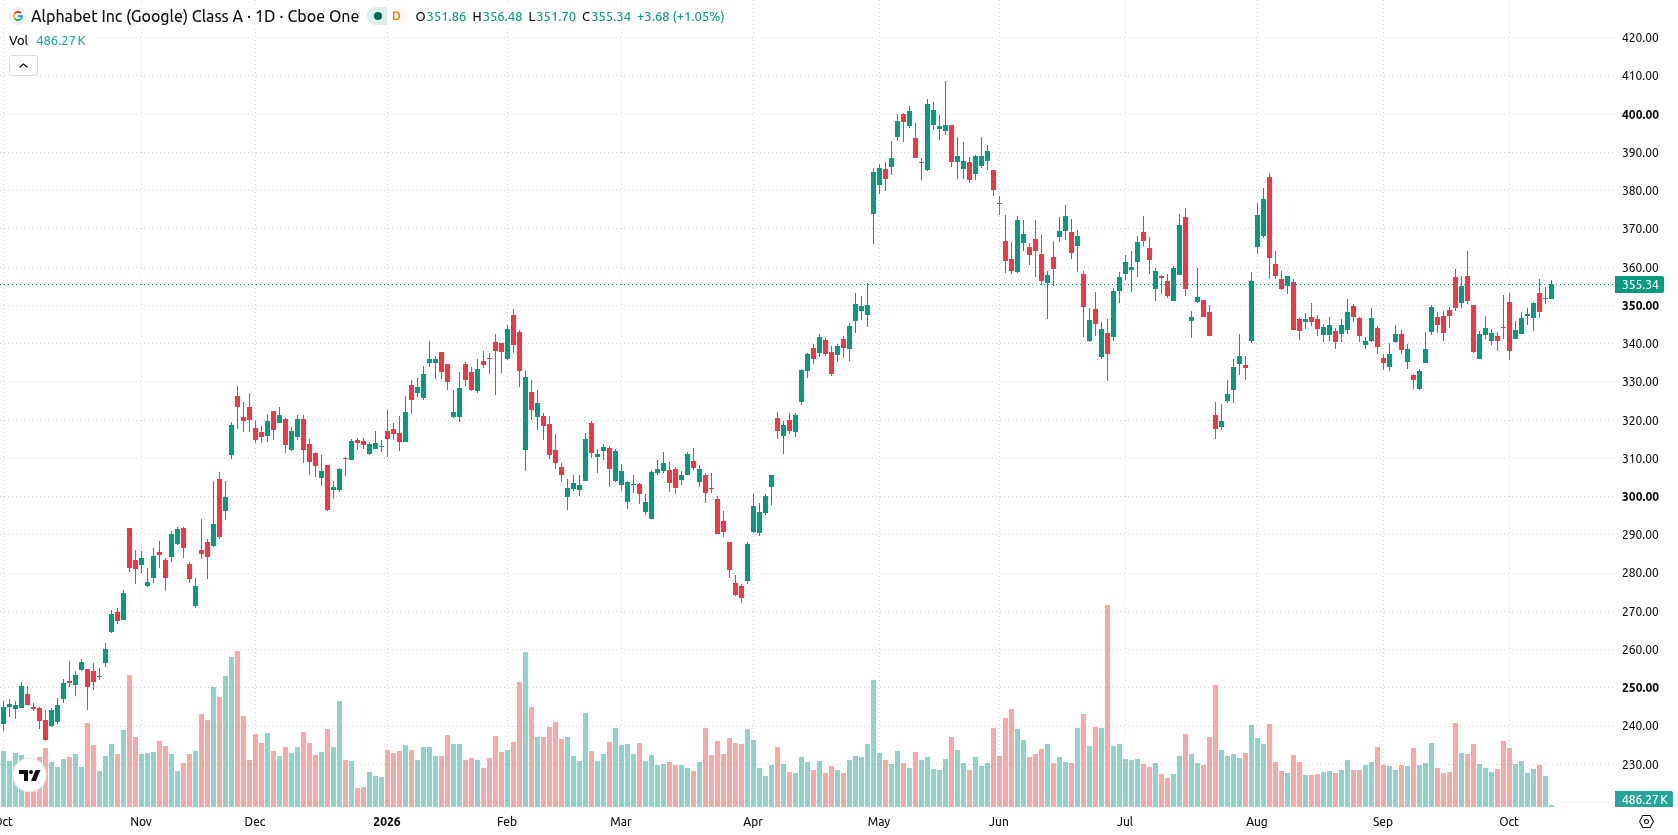
Overbought technicals signal caution as shares consolidate near resistance
The daily chart shows price action at the very top of the recent weekly range, with volatility at 3.53% and momentum characterized by a contained move within a narrow range. Both the CCI at 108.57 and Stochastic RSI at 100 are in the overbought zone, while MACD points to ongoing upside. Immediate support is at $346.3 and the Ichimoku Kijun at $345.82, with resistance at $355.23. This positioning suggests consolidation just below resistance, but overbought momentum readings may warrant caution if profit-taking sets in.
Upside bias holds for next week as bullish breakout risk builds
Over the next five trading days, Alphabet shares are expected to trade between $348.02 and $362.9. There is a 77% probability of an increase and a 23% probability of a decrease. The base case scenario is further consolidation inside this range, anchored by support at $346.3. A break above $355.23 would open room for a bullish extension toward the high end of the range, while a move below $346.3 could trigger a pullback toward the lower band at $348.02.
Previously it was reported that Google has begun testing its AI chips in low Earth orbit, signaling early efforts to address the growing energy and resource demands of advanced computing. The current trading landscape incorporates this push into space-based infrastructure as an evolving backdrop, with traders advised to watch for a confirmed breakout above $355.23 as the next actionable signal.











-
 Afghanistan
-
 Albania
-
 Algeria
-
 Angola
-
 Argentina
-
 Armenia
-
 Australia
-
 Austria
-
 Azerbaijan
-
 Bahamas
-
 Bahrain
-
 Bangladesh
-
 Belarus
-
 Belgium
-
 Bolivia
-
 Botswana
-
 Brazil
-
 Brunei
-
 Bulgaria
-
 Cambodia
-
 Cameroon
-
 Canada
-
 Chile
Chile
-
 China
China
-
 Colombia
-
 Congo
Congo
-
 Costa Rica
-
 Cote d'Ivoire
-
 Croatia
-
 Cuba
Cuba
-
 Cyprus
-
 Czechia
-
 DR Congo
-
 Denmark
-
 Dominican Republic
-
 Ecuador
-
 Egypt
Egypt
-
 El Salvador
-
 Estonia
-
 Eswatini
-
 Ethiopia
-
 Finland
-
 France
-
 Georgia
-
 Germany
-
 Ghana
Ghana
-
 Greece
-
 Haiti
Haiti
-
 Hong Kong
-
 Hungary
-
 India
India
-
 Indonesia
-
 Iran, Islamic republic
-
 Iraq
Iraq
-
 Ireland
-
 Israel
-
 Italy
Italy
-
 Jamaica
-
 Japan
Japan
-
 Jordan
-
 Kazakhstan
-
 Kenya
Kenya
-
 Korea
Korea
-
 Kuwait
-
 Kyrgyzstan
-
 Laos
Laos
-
 Latvia
-
 Lebanon
-
 Lesotho
-
 Libya
Libya
-
 Lithuania
-
 Luxembourg
-
 Madagascar
-
 Malaysia
-
 Malta
Malta
-
 Mauritius
-
 Mexico
-
 Moldova
-
 Mongolia
-
 Montenegro
-
 Morocco
-
 Mozambique
-
 Myanmar
-
 Namibia
-
 Nepal
Nepal
-
 Netherlands
-
 New Zealand
-
 Nigeria
-
 North Macedonia
-
 Norway
-
 Oman
Oman
-
 Pakistan
-
 Palestine
-
 Panama
-
 Papua New Guinea
-
 Paraguay
-
 Peru
Peru
-
 Philippines
-
 Poland
-
 Portugal
-
 Puerto Rico
-
 Qatar
Qatar
-
 Reunion
-
 Romania
-
 Rwanda
-
 Saudi Arabia
-
 Serbia
-
 Singapore
-
 Slovakia
-
 Slovenia
-
 Somalia
-
 South Africa
-
 Spain
Spain
-
 Sri Lanka
-
 Sweden
-
 Switzerland
-
 Syria
Syria
-
 Taiwan
-
 Tajikistan
-
 Tanzania
-
 Thailand
-
 Trinidad and Tobago
-
 Tunisia
-
 Turkey
-
 UAE
UAE
-
 Uganda
-
 Ukraine
-
 United Kingdom
-
United States
-
 Uruguay
-
 Uzbekistan
-
 Venezuela
-
 Vietnam
-
 Yemen
Yemen
-
 Zambia
-
 Zimbabwe
- Forex
- Crypto












