

ABX gains as buyer support maintains short-term trend above moving averages

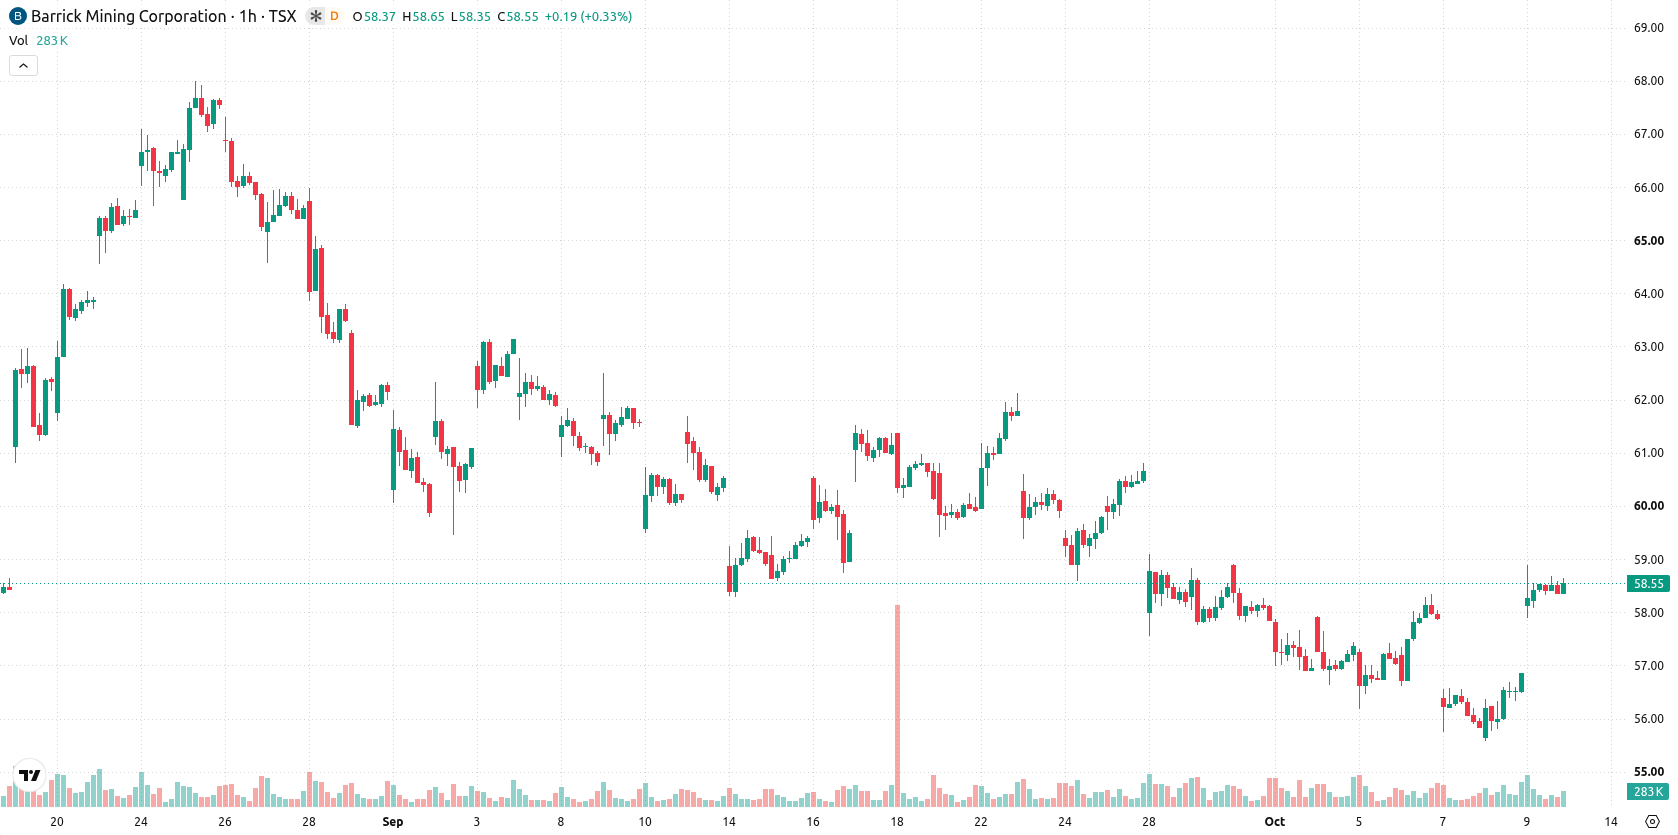
Barrick Gold (ABX) stock is trading at C$58.53, up 2.94% on the day. The asset sits above its key short- and medium-term moving averages, while remaining below its long-term average.
 58.88
58.88
58.88
58.88
Highlights
- ABX/CAD currently trades above short- and medium-term moving averages but remains below the long-term trend level.
- Momentum indicators such as MACD, ADX, CCI, and RSI show ongoing buyer dominance, though multiple oscillators flag overbought conditions.
- The forecast range for the next few sessions is C$57.09 to C$59.97, with a 76% probability of an upward move and key support seen at C$57.23.
Momentum sustained as multiple indicators flag overbought risks
On the technical side, the price is positioned above the MA-20 and MA-50, while remaining below the MA-200 which continues to cap the longer-term trend. Immediate support is seen at the Ichimoku Kijun, currently at C$57.23. Bullish momentum persists with both the MACD and ADX suggesting sustained buying interest. The RSI is in the buy zone at 67, CCI is also flashing a buy signal, and both Stoch RSI and Bull/Bear Power indicate overbought conditions with strong buyer control. However, the Awesome Oscillator is neutral, offering no further confirmation of upward direction. Overbought signals on several oscillators introduce some short-term divergence risk.
Range-bound action likely as bullish breakout probabilities rise
Looking ahead, ABX is expected to trade within a C$57.09 to C$59.97 volatility band relative to current levels over the next few sessions. The probability of an upward break is estimated at 76%, while downside moves are less likely in the immediate term. The most probable near-term scenario is range-bound consolidation within these levels; a move above C$59.97 would open room for fresh bullish momentum, whereas a drop below the C$57.09 support and the Ichimoku Kijun could set up a corrective pullback.
Earlier, analysts noted that Barrick Gold was showing signs of short-term strength while remaining constrained by long-term resistance. The current analysis reinforces this view, highlighting continued bullish momentum but emphasizing that a clear directional break remains contingent on the next move beyond the established technical thresholds.





Latest Barrick Gold News





-
 Afghanistan
-
 Albania
-
 Algeria
-
 Angola
-
 Argentina
-
 Armenia
-
 Australia
-
 Austria
-
 Azerbaijan
-
 Bahamas
-
 Bahrain
-
 Bangladesh
-
 Belarus
-
 Belgium
-
 Bolivia
-
 Botswana
-
 Brazil
-
 Brunei
-
 Bulgaria
-
 Cambodia
-
 Cameroon
-
 Canada
-
 Chile
Chile
-
 China
China
-
 Colombia
-
 Congo
Congo
-
 Costa Rica
-
 Cote d'Ivoire
-
 Croatia
-
 Cuba
Cuba
-
 Cyprus
-
 Czechia
-
 DR Congo
-
 Denmark
-
 Dominican Republic
-
 Ecuador
-
 Egypt
Egypt
-
 El Salvador
-
 Estonia
-
 Eswatini
-
 Ethiopia
-
 Finland
-
 France
-
 Georgia
-
 Germany
-
 Ghana
Ghana
-
 Greece
-
 Haiti
Haiti
-
 Hong Kong
-
 Hungary
-
 India
India
-
 Indonesia
-
 Iran, Islamic republic
-
 Iraq
Iraq
-
 Ireland
-
 Israel
-
 Italy
Italy
-
 Jamaica
-
 Japan
Japan
-
 Jordan
-
 Kazakhstan
-
 Kenya
Kenya
-
 Korea
Korea
-
 Kuwait
-
 Kyrgyzstan
-
 Laos
Laos
-
 Latvia
-
 Lebanon
-
 Lesotho
-
 Libya
Libya
-
 Lithuania
-
 Luxembourg
-
 Madagascar
-
 Malaysia
-
 Malta
Malta
-
 Mauritius
-
 Mexico
-
 Moldova
-
 Mongolia
-
 Montenegro
-
 Morocco
-
 Mozambique
-
 Myanmar
-
 Namibia
-
 Nepal
Nepal
-
 Netherlands
-
 New Zealand
-
 Nigeria
-
 North Macedonia
-
 Norway
-
 Oman
Oman
-
 Pakistan
-
 Palestine
-
 Panama
-
 Papua New Guinea
-
 Paraguay
-
 Peru
Peru
-
 Philippines
-
 Poland
-
 Portugal
-
 Puerto Rico
-
 Qatar
Qatar
-
 Reunion
-
 Romania
-
 Rwanda
-
 Saudi Arabia
-
 Serbia
-
 Singapore
-
 Slovakia
-
 Slovenia
-
 Somalia
-
 South Africa
-
 Spain
Spain
-
 Sri Lanka
-
 Sweden
-
 Switzerland
-
 Syria
Syria
-
 Taiwan
-
 Tajikistan
-
 Tanzania
-
 Thailand
-
 Trinidad and Tobago
-
 Tunisia
-
 Turkey
-
 UAE
UAE
-
 Uganda
-
 Ukraine
-
 United Kingdom
-
United States
-
 Uruguay
-
 Uzbekistan
-
 Venezuela
-
 Vietnam
-
 Yemen
Yemen
-
 Zambia
-
 Zimbabwe
- Forex
- Crypto












