

Johnson & Johnson stock falls as weak momentum dominates short-term trading

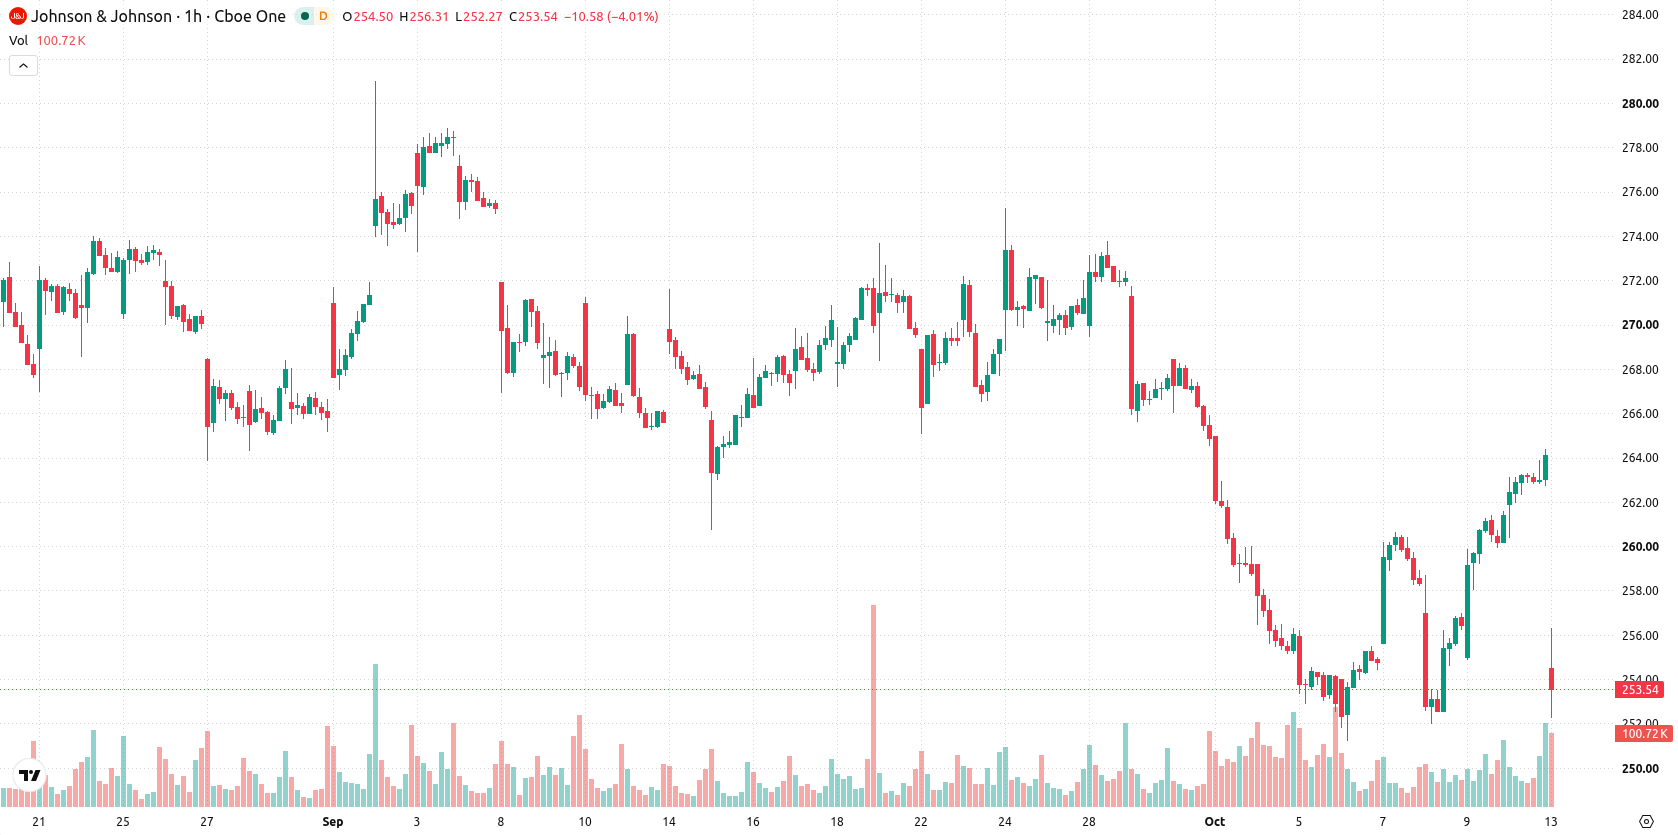
Johnson & Johnson (JNJ) stock is trading at $251.79, down 4.64% for the day. The price currently sits below its key short- and medium-term moving averages while remaining above the long-term average, indicating a divergence between short-term weakness and sustained longer-term support.
 253.84
264.13
253.84
264.13
Highlights
- Johnson & Johnson reported adjusted earnings per share of $2.59 and revenue of $25.40 billion for the third quarter of 2026, both above consensus expectations.
- Pharmaceutical sales grew nearly 8% over the medical device segment, with the company raising its full-year 2026 profit guidance and confirming a $1.34 quarterly dividend.
- Shares of Johnson & Johnson fell 4.64% to $251.79, with technical signals mixed and a projected trading range of $246.38 to $265.51 over the next several sessions.
Earnings momentum and guidance lift sentiment amid selling pressure
Johnson & Johnson reported adjusted earnings per share of $2.59 for the third quarter of 2026, surpassing consensus expectations and highlighting operational strength, according to MarketBeat. The company also delivered revenue of approximately $25.40 billion in the same period, alongside nearly 8% growth in pharmaceutical sales versus the medical device business as stated by Qz. In addition, Johnson & Johnson raised its full-year 2026 profit guidance and confirmed it will maintain a quarterly dividend of $1.34 per share, payable December 8, 2026, details Marketscreener. These developments point to continued earnings momentum and stable shareholder returns, though price action has remained under broader selling pressure.
Momentum split and technical barriers fuel uncertainty on direction
Technically, JNJ is trading below the MA-20 at $260.28 and MA-50 at $257.49 but remains above the MA-200 at $243.22. Immediate resistance is marked by the Ichimoku Kijun at $258.16, with key support at the MA-200. Momentum indicators present a mixed picture: RSI, Stochastic RSI, CCI, and Bull/Bear Power signal overbought conditions and strong buyer activity, whereas MACD and ADX are in buy territory and the Awesome Oscillator remains neutral. This combination of robust momentum signals alongside weak daily price action suggests notable uncertainty regarding the sustainability of current levels.
Downside risk dominates as consolidation defines near-term outlook
Over the next two to three trading days, the expected price range for JNJ is $246.38 to $265.51, reflecting a typical volatility band relative to current levels. There is a 24% probability of an upward move, with a 76% likelihood of continued downside. Consolidation within this range now appears as the baseline scenario; an upside breakout would require JNJ to close above $258.16, while renewed weakness below $246.38 could signal a deeper correction.
Previously it was reported that Johnson & Johnson’s third-quarter results exceeded expectations, supported by strong pharmaceutical sales amid continuing international headwinds. The latest trading outlook highlights a consolidation scenario within the $246.38 to $265.51 range, with any decisive move above $258.16 serving as the key trigger to monitor for a potential shift in trend.





Latest Johnson & Johnson News






-
 Afghanistan
-
 Albania
-
 Algeria
-
 Angola
-
 Argentina
-
 Armenia
-
 Australia
-
 Austria
-
 Azerbaijan
-
 Bahamas
-
 Bahrain
-
 Bangladesh
-
 Belarus
-
 Belgium
-
 Bolivia
-
 Botswana
-
 Brazil
-
 Brunei
-
 Bulgaria
-
 Cambodia
-
 Cameroon
-
 Canada
-
 Chile
Chile
-
 China
China
-
 Colombia
-
 Congo
Congo
-
 Costa Rica
-
 Cote d'Ivoire
-
 Croatia
-
 Cuba
Cuba
-
 Cyprus
-
 Czechia
-
 DR Congo
-
 Denmark
-
 Dominican Republic
-
 Ecuador
-
 Egypt
Egypt
-
 El Salvador
-
 Estonia
-
 Eswatini
-
 Ethiopia
-
 Finland
-
 France
-
 Georgia
-
 Germany
-
 Ghana
Ghana
-
 Greece
-
 Haiti
Haiti
-
 Hong Kong
-
 Hungary
-
 India
India
-
 Indonesia
-
 Iran, Islamic republic
-
 Iraq
Iraq
-
 Ireland
-
 Israel
-
 Italy
Italy
-
 Jamaica
-
 Japan
Japan
-
 Jordan
-
 Kazakhstan
-
 Kenya
Kenya
-
 Korea
Korea
-
 Kuwait
-
 Kyrgyzstan
-
 Laos
Laos
-
 Latvia
-
 Lebanon
-
 Lesotho
-
 Libya
Libya
-
 Lithuania
-
 Luxembourg
-
 Madagascar
-
 Malaysia
-
 Malta
Malta
-
 Mauritius
-
 Mexico
-
 Moldova
-
 Mongolia
-
 Montenegro
-
 Morocco
-
 Mozambique
-
 Myanmar
-
 Namibia
-
 Nepal
Nepal
-
 Netherlands
-
 New Zealand
-
 Nigeria
-
 North Macedonia
-
 Norway
-
 Oman
Oman
-
 Pakistan
-
 Palestine
-
 Panama
-
 Papua New Guinea
-
 Paraguay
-
 Peru
Peru
-
 Philippines
-
 Poland
-
 Portugal
-
 Puerto Rico
-
 Qatar
Qatar
-
 Reunion
-
 Romania
-
 Rwanda
-
 Saudi Arabia
-
 Serbia
-
 Singapore
-
 Slovakia
-
 Slovenia
-
 Somalia
-
 South Africa
-
 Spain
Spain
-
 Sri Lanka
-
 Sweden
-
 Switzerland
-
 Syria
Syria
-
 Taiwan
-
 Tajikistan
-
 Tanzania
-
 Thailand
-
 Trinidad and Tobago
-
 Tunisia
-
 Turkey
-
 UAE
UAE
-
 Uganda
-
 Ukraine
-
 United Kingdom
-
United States
-
 Uruguay
-
 Uzbekistan
-
 Venezuela
-
 Vietnam
-
 Yemen
Yemen
-
 Zambia
-
 Zimbabwe
- Forex
- Crypto












