

Caterpillar stock extends downward price move as seller pressure dominates after yield surge

Caterpillar Inc. (CAT) stock is trading at $773.42, down 3.33% on the day. The share price is currently positioned below its key short-, medium-, and long-term moving averages.
 789.22
843.55
789.22
843.55
Highlights
- A jump in 30-year Treasury yields to 5.7 percent raised long-term borrowing costs and pressured Caterpillar stock.
- Higher yields reduced incentive for capital investment in heavy equipment, weighing on demand for industrial machinery.
- Caterpillar shares trade below key moving averages with downside signals dominant and a projected range of $749.07 to $799.82.
Rising Treasury yields pressure CAT by boosting long-term borrowing costs
On October 7, a sharp rise in the 30-year Treasury yield to 5.7%, its highest in over two decades, weighed on Caterpillar shares by increasing long-term borrowing costs and reducing incentive for capital investment in heavy equipment. Elevated yields tend to diminish demand for capital-intensive goods, which exerts pressure on companies supplying industrial machinery. These dynamics contributed to the recent decline in Caterpillar's stock alongside broader caution affecting rate-sensitive equities.
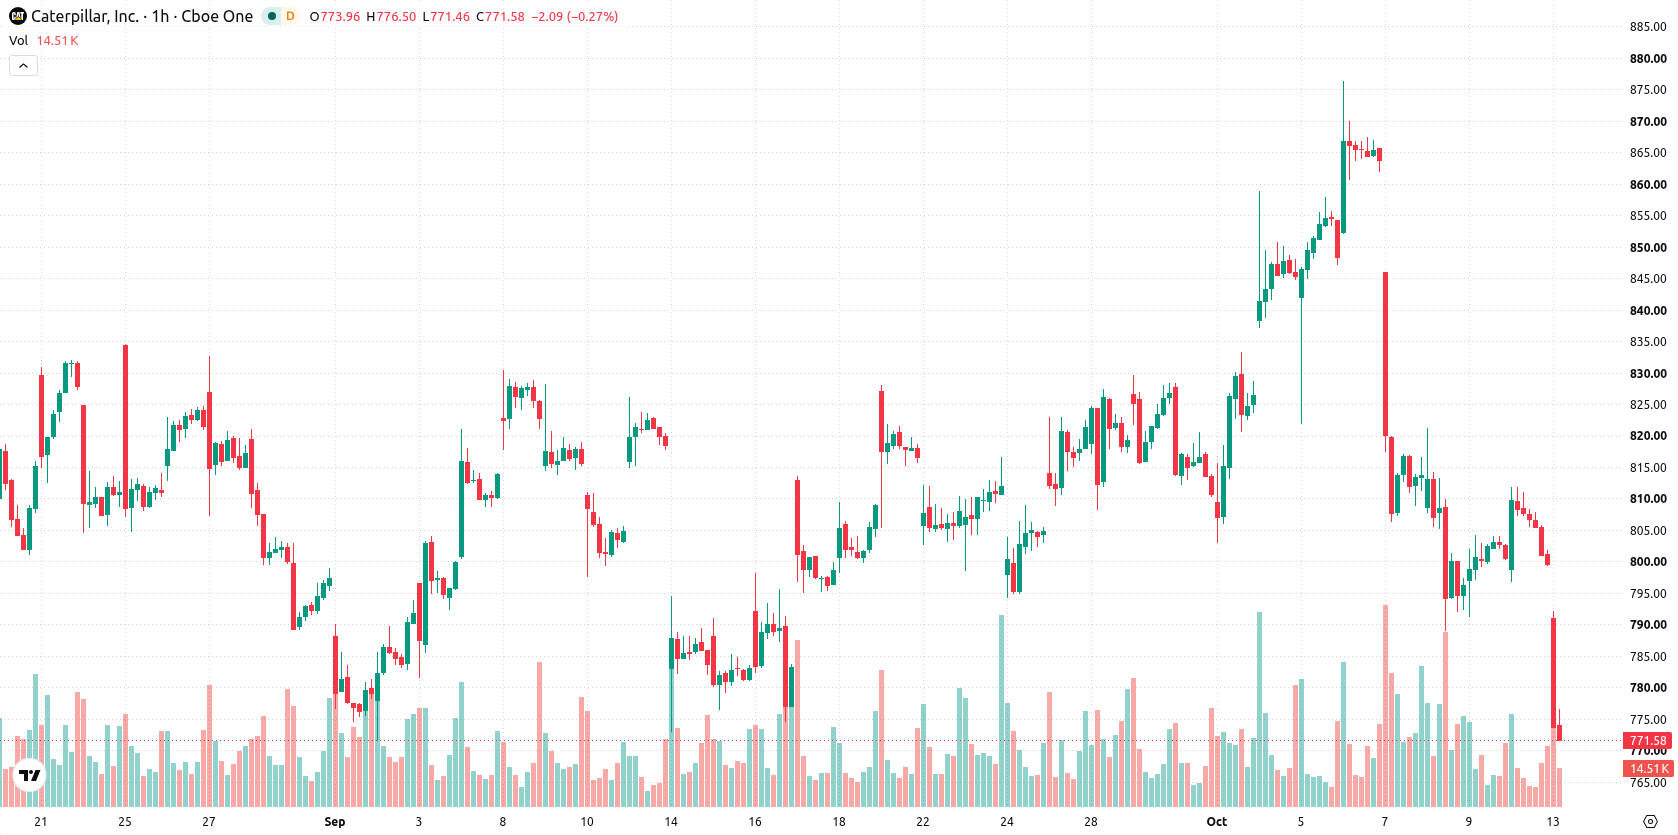
Weak momentum signals as CAT trades beneath multiple resistance levels
On the technical front, CAT is trading below the MA-20 ($802.36) and MA-50 ($826.82) on the H1 chart, as well as the MA-200 ($802.4) on the daily timeframe. The immediate resistance is marked by the Ichimoku Kijun at $805.4, while key support is found near $749.07. Momentum indicators show MACD at Strong Sell, while ADX is Neutral, indicating that the move lacks strong directional conviction. RSI stands at 37.65 (Sell), Bull/Bear Power points to oversold conditions, and CCI, Stoch RSI, and Awesome Oscillator all remain Neutral, with little sign of buyer support.
Downside risk persists as breakout prospects remain subdued
Looking ahead, CAT is expected to trade within a band between $749.07 and $799.82 in the coming sessions. The likelihood of an upward breakout is currently very low, while downside pressure remains elevated. If selling persists, CAT could test support near $749, whereas overcoming resistance at $805.4 would be needed to signal a potential recovery. For now, the base scenario calls for continued range-bound movement within these levels.
Earlier, analysts noted that Caterpillar’s outlook was weighed by ongoing technical weakness and range-bound price action despite expansion initiatives and sustained dividend growth. The current analysis reinforces the persistence of downside risk, highlighting $749 as a critical support level to monitor for potential breaks in the sessions ahead.





Latest Caterpillar News





-
 Afghanistan
-
 Albania
-
 Algeria
-
 Angola
-
 Argentina
-
 Armenia
-
 Australia
-
 Austria
-
 Azerbaijan
-
 Bahamas
-
 Bahrain
-
 Bangladesh
-
 Belarus
-
 Belgium
-
 Bolivia
-
 Botswana
-
 Brazil
-
 Brunei
-
 Bulgaria
-
 Cambodia
-
 Cameroon
-
 Canada
-
 Chile
Chile
-
 China
China
-
 Colombia
-
 Congo
Congo
-
 Costa Rica
-
 Cote d'Ivoire
-
 Croatia
-
 Cuba
Cuba
-
 Cyprus
-
 Czechia
-
 DR Congo
-
 Denmark
-
 Dominican Republic
-
 Ecuador
-
 Egypt
Egypt
-
 El Salvador
-
 Estonia
-
 Eswatini
-
 Ethiopia
-
 Finland
-
 France
-
 Georgia
-
 Germany
-
 Ghana
Ghana
-
 Greece
-
 Haiti
Haiti
-
 Hong Kong
-
 Hungary
-
 India
India
-
 Indonesia
-
 Iran, Islamic republic
-
 Iraq
Iraq
-
 Ireland
-
 Israel
-
 Italy
Italy
-
 Jamaica
-
 Japan
Japan
-
 Jordan
-
 Kazakhstan
-
 Kenya
Kenya
-
 Korea
Korea
-
 Kuwait
-
 Kyrgyzstan
-
 Laos
Laos
-
 Latvia
-
 Lebanon
-
 Lesotho
-
 Libya
Libya
-
 Lithuania
-
 Luxembourg
-
 Madagascar
-
 Malaysia
-
 Malta
Malta
-
 Mauritius
-
 Mexico
-
 Moldova
-
 Mongolia
-
 Montenegro
-
 Morocco
-
 Mozambique
-
 Myanmar
-
 Namibia
-
 Nepal
Nepal
-
 Netherlands
-
 New Zealand
-
 Nigeria
-
 North Macedonia
-
 Norway
-
 Oman
Oman
-
 Pakistan
-
 Palestine
-
 Panama
-
 Papua New Guinea
-
 Paraguay
-
 Peru
Peru
-
 Philippines
-
 Poland
-
 Portugal
-
 Puerto Rico
-
 Qatar
Qatar
-
 Reunion
-
 Romania
-
 Rwanda
-
 Saudi Arabia
-
 Serbia
-
 Singapore
-
 Slovakia
-
 Slovenia
-
 Somalia
-
 South Africa
-
 Spain
Spain
-
 Sri Lanka
-
 Sweden
-
 Switzerland
-
 Syria
Syria
-
 Taiwan
-
 Tajikistan
-
 Tanzania
-
 Thailand
-
 Trinidad and Tobago
-
 Tunisia
-
 Turkey
-
 UAE
UAE
-
 Uganda
-
 Ukraine
-
 United Kingdom
-
United States
-
 Uruguay
-
 Uzbekistan
-
 Venezuela
-
 Vietnam
-
 Yemen
Yemen
-
 Zambia
-
 Zimbabwe
- Forex
- Crypto












