

Operational efficiency focus lifts Suncor Energy stock as buyer support strengthens

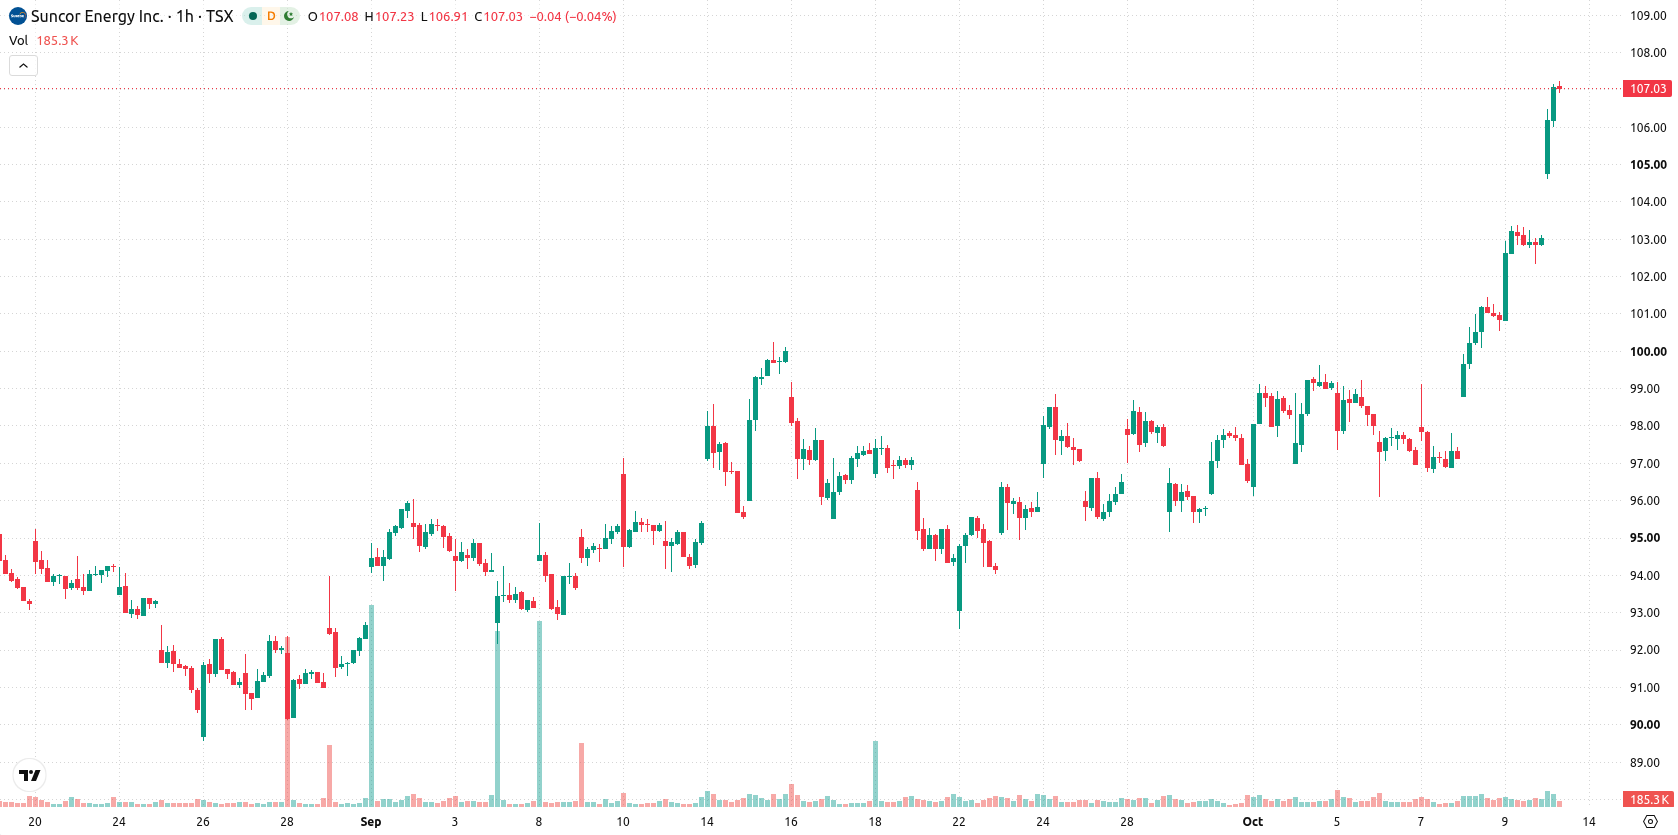
Suncor Energy (SU) stock is trading at C$106.7, up 3.54% on the day and near its session high. The price action positions SU above its key moving averages, indicating active buying momentum within the current session.
 107.34
107.34
107.34
Highlights
- Suncor Energy is supporting output stability and cost management in oil sands through investment in technology, efficiency, and environmental compliance.
- The company is reviewing offshore assets and may increase focus on core oil sands and refining businesses to align operations with more resilient assets.
- Shares of Suncor trade with a bullish bias above key moving averages, with strong buying signals and an expected short-term range of C$103.75 to C$109.65.
Strategic refocus and efficiencies drive fresh buying momentum
Suncor Energy’s ongoing investment in technology, operational efficiency, and environmental compliance is reinforcing its strength in oil sands production, supporting both output stability and cost management according to Kalkinemedia. These measures enhance the company’s ability to maintain competitiveness, which is viewed as a key factor for recent buying interest. At the same time, Suncor’s review of its offshore asset portfolio and a potential increased focus on its core oil sands and refining businesses amid broader sector challenges may further align operations with its most resilient assets.
Sustained bullish momentum as price clears key technical levels
On the h1 chart, SU is trading above the MA-20 at C$100.37 and the MA-50 at C$99.08, with daily levels also above the MA-200 at C$84.64. The Ichimoku Kijun on the daily timeframe marks immediate support at C$100.04. Momentum indicators reflect a bullish bias: MACD, ADX, and CCI all indicate ongoing buying strength, and RSI is elevated at 74.16. Bull/Bear Power confirms buyer dominance, while Stoch RSI and Awesome Oscillator are neutral, revealing some divergence within short-term oscillators.
Upside breakout risk dominates as trading range narrows
Over the next two to three sessions, SU is expected to fluctuate within a C$103.75 to C$109.65 range, reflecting typical volatility around its current levels. The probability of an upward move is rated very high, while the risk of a downside move is low. The baseline outlook is for price stabilization inside this corridor, with a bullish breakout scenario above C$109.65 and a bearish reversal contingent on a sustained break below C$103.75.
Previously it was reported that Suncor Energy’s divestment of offshore assets was intended to sharpen its focus on core oil sands and refining businesses, reinforcing the company’s positive technical and operational trajectory. The latest price action and ongoing operational enhancements validate this approach, with sustained buying momentum making a breakout above the C$109.65 resistance the key level to monitor in the coming sessions.









-
 Afghanistan
-
 Albania
-
 Algeria
-
 Angola
-
 Argentina
-
 Armenia
-
 Australia
-
 Austria
-
 Azerbaijan
-
 Bahamas
-
 Bahrain
-
 Bangladesh
-
 Belarus
-
 Belgium
-
 Bolivia
-
 Botswana
-
 Brazil
-
 Brunei
-
 Bulgaria
-
 Cambodia
-
 Cameroon
-
 Canada
-
 Chile
Chile
-
 China
China
-
 Colombia
-
 Congo
Congo
-
 Costa Rica
-
 Cote d'Ivoire
-
 Croatia
-
 Cuba
Cuba
-
 Cyprus
-
 Czechia
-
 DR Congo
-
 Denmark
-
 Dominican Republic
-
 Ecuador
-
 Egypt
Egypt
-
 El Salvador
-
 Estonia
-
 Eswatini
-
 Ethiopia
-
 Finland
-
 France
-
 Georgia
-
 Germany
-
 Ghana
Ghana
-
 Greece
-
 Haiti
Haiti
-
 Hong Kong
-
 Hungary
-
 India
India
-
 Indonesia
-
 Iran, Islamic republic
-
 Iraq
Iraq
-
 Ireland
-
 Israel
-
 Italy
Italy
-
 Jamaica
-
 Japan
Japan
-
 Jordan
-
 Kazakhstan
-
 Kenya
Kenya
-
 Korea
Korea
-
 Kuwait
-
 Kyrgyzstan
-
 Laos
Laos
-
 Latvia
-
 Lebanon
-
 Lesotho
-
 Libya
Libya
-
 Lithuania
-
 Luxembourg
-
 Madagascar
-
 Malaysia
-
 Malta
Malta
-
 Mauritius
-
 Mexico
-
 Moldova
-
 Mongolia
-
 Montenegro
-
 Morocco
-
 Mozambique
-
 Myanmar
-
 Namibia
-
 Nepal
Nepal
-
 Netherlands
-
 New Zealand
-
 Nigeria
-
 North Macedonia
-
 Norway
-
 Oman
Oman
-
 Pakistan
-
 Palestine
-
 Panama
-
 Papua New Guinea
-
 Paraguay
-
 Peru
Peru
-
 Philippines
-
 Poland
-
 Portugal
-
 Puerto Rico
-
 Qatar
Qatar
-
 Reunion
-
 Romania
-
 Rwanda
-
 Saudi Arabia
-
 Serbia
-
 Singapore
-
 Slovakia
-
 Slovenia
-
 Somalia
-
 South Africa
-
 Spain
Spain
-
 Sri Lanka
-
 Sweden
-
 Switzerland
-
 Syria
Syria
-
 Taiwan
-
 Tajikistan
-
 Tanzania
-
 Thailand
-
 Trinidad and Tobago
-
 Tunisia
-
 Turkey
-
 UAE
UAE
-
 Uganda
-
 Ukraine
-
 United Kingdom
-
United States
-
 Uruguay
-
 Uzbekistan
-
 Venezuela
-
 Vietnam
-
 Yemen
Yemen
-
 Zambia
-
 Zimbabwe
- Forex
- Crypto












