

Suncor Energy shares technical analysis: Seller pressure and oversold signals weigh on outlook

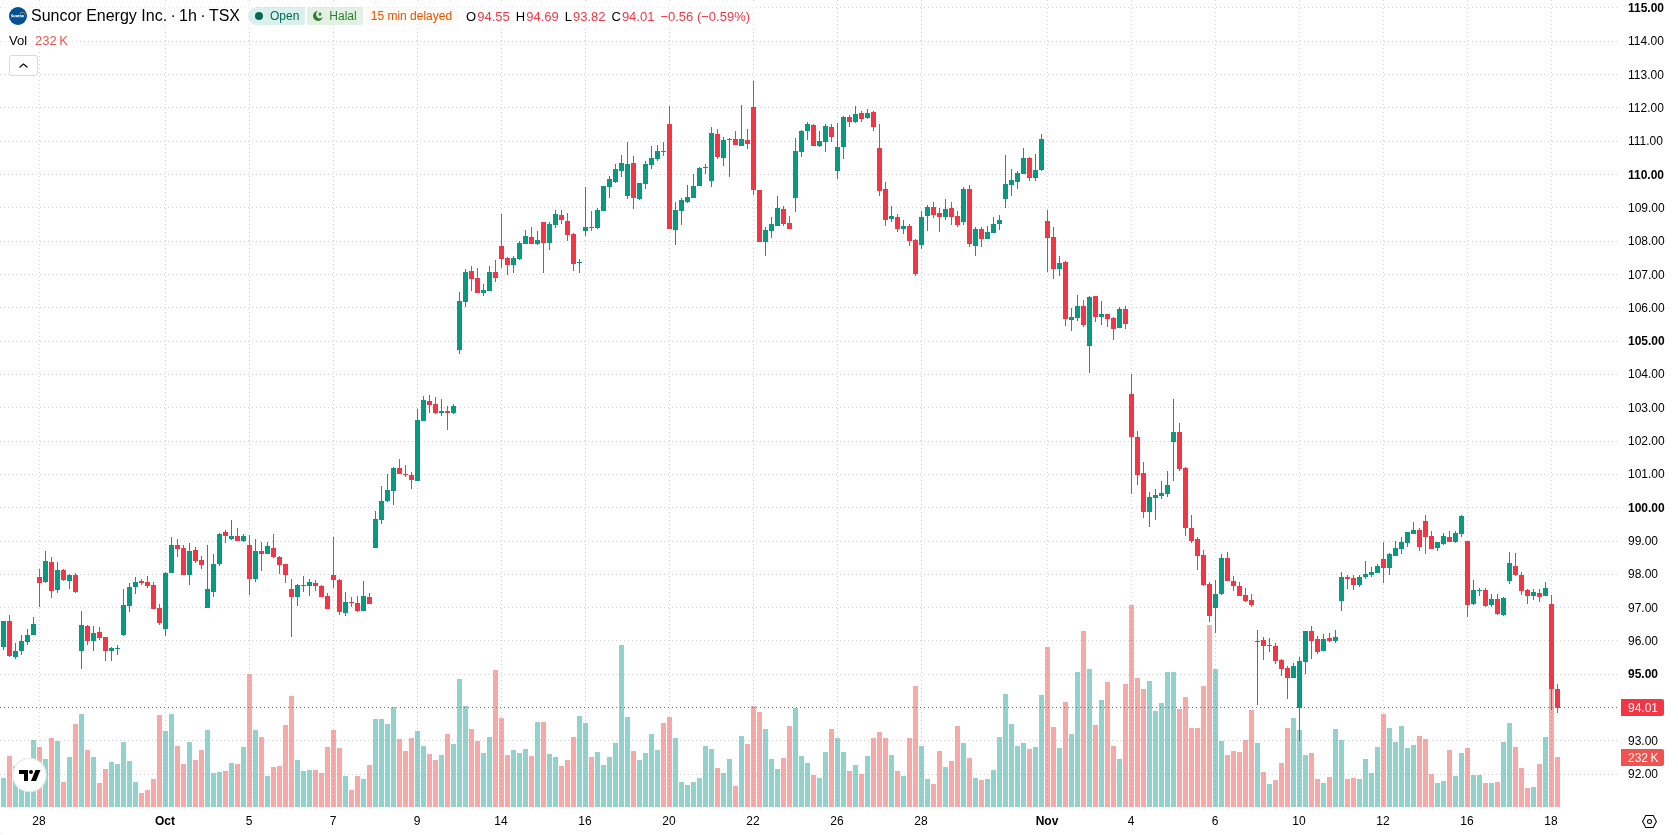
Suncor Energy Inc. (SU) stock is trading at C$93.37, registering a decline of 4.35% on the day. The price is positioned below its key short- and medium-term moving averages, while staying above its longer-term benchmark.
 96.97
99.76
Highlights
- The Public Sector Pension Investment Board increased its position in Suncor Energy shares by 47.3% in the third quarter.
- Shares of Suncor Energy have experienced sustained selling pressure and closed down 4.35% to C$93.37 in the most recent session.
- Suncor shares trade below key short-term averages with strong downside signals; a range of C$92.01 to C$94.73 is expected in the coming sessions.
Institutional accumulation offsets float selling amid persistent price pressure
The Public Sector Pension Investment Board significantly increased its holdings in Suncor Energy Inc. by 47.3% during the third quarter, as documented in a recent 13F SEC filing and reported by MarketBeat. This notable institutional accumulation added direct buying demand for SU shares during the reported period, which may have helped offset selling activity in the float. However, the current market context has seen continued downward pressure on the stock price.
Oversold signals persist as downside momentum challenges long-term support
On the technical front, SU is trading well below the H1 SMA-20 at C$97.71 and the H1 SMA-50 at C$97.39, but remains above the D1 SMA-200 at C$89.64. The Ichimoku Kijun resistance is established at C$96.85. Momentum indicators show MACD and ADX producing sell signals, while RSI, Stoch RSI, and CCI remain in oversold territory, all suggesting persistent downside but with the potential for short-term bounce. Bull/Bear Power is negative, reflecting intraday seller dominance, and the Awesome Oscillator maintains support for the prevailing downward movement.
Downside risks dominate as breakout needed to reverse negative trend
In the short term, SU is expected to trade within a C$92.01 to C$94.73 volatility band relative to current levels. The likelihood of an upward move is estimated at 21%, implying that a further decline is the more probable scenario unless the stock breaches immediate resistance at C$96.85. If SU falls below C$92.01, this could trigger accelerated losses, while a decisive breakout above C$96.85 would be required to reverse the current trend.
Earlier, analysts noted that Suncor Energy continued to face short-term downside risks despite signs of institutional accumulation and asset divestment initiatives. The current analysis strengthens that outlook, highlighting that persistent technical weakness underscores the importance of monitoring for a potential breakdown below the C$92.01 level.








-
 Afghanistan
-
 Albania
-
 Algeria
-
 Angola
-
 Argentina
-
 Armenia
-
 Australia
-
 Austria
-
 Azerbaijan
-
 Bahamas
-
 Bahrain
-
 Bangladesh
-
 Belarus
-
 Belgium
-
 Bolivia
-
 Botswana
-
 Brazil
-
 Brunei
-
 Bulgaria
-
 Cambodia
-
 Cameroon
-
 Canada
-
 Chile
-
 China
-
 Colombia
-
 Congo
-
 Costa Rica
-
 Cote d'Ivoire
-
 Croatia
-
 Cuba
-
 Cyprus
-
 Czechia
-
 DR Congo
-
 Denmark
-
 Dominican Republic
-
 Ecuador
-
 Egypt
-
 El Salvador
-
 Estonia
-
 Eswatini
-
 Ethiopia
-
 Finland
-
 France
-
 Georgia
-
 Germany
-
 Ghana
-
 Greece
-
 Haiti
-
 Hong Kong
-
 Hungary
-
 India
-
 Indonesia
-
 Iran, Islamic republic
-
 Iraq
-
 Ireland
-
 Israel
-
 Italy
-
 Jamaica
-
 Japan
-
 Jordan
-
 Kazakhstan
-
 Kenya
-
 Korea
-
 Kuwait
-
 Kyrgyzstan
-
 Laos
-
 Latvia
-
 Lebanon
-
 Lesotho
-
 Libya
-
 Lithuania
-
 Luxembourg
-
 Madagascar
-
 Malaysia
-
 Malta
-
 Mauritius
-
 Mexico
-
 Moldova
-
 Mongolia
-
 Montenegro
-
 Morocco
-
 Mozambique
-
 Myanmar
-
 Namibia
-
 Nepal
-
 Netherlands
-
 New Zealand
-
 Nigeria
-
 North Macedonia
-
 Norway
-
 Oman
-
 Pakistan
-
 Palestine
-
 Panama
-
 Papua New Guinea
-
 Paraguay
-
 Peru
-
 Philippines
-
 Poland
-
 Portugal
-
 Puerto Rico
-
 Qatar
-
 Reunion
-
 Romania
-
 Rwanda
-
 Saudi Arabia
-
 Serbia
-
 Singapore
-
 Slovakia
-
 Slovenia
-
 Somalia
-
 South Africa
-
 Spain
-
 Sri Lanka
-
 Sweden
-
 Switzerland
-
 Syria
-
 Taiwan
-
 Tajikistan
-
 Tanzania
-
 Thailand
-
 Trinidad and Tobago
-
 Tunisia
-
 Turkey
-
 UAE
-
 Uganda
-
 Ukraine
-
 United Kingdom
-
United States
-
 Uruguay
-
 Uzbekistan
-
 Venezuela
-
 Vietnam
-
 Yemen
-
 Zambia
-
 Zimbabwe
- Forex
- Crypto












