

Suncor Energy stock extends pullback as seller pressure dominates near-term trading

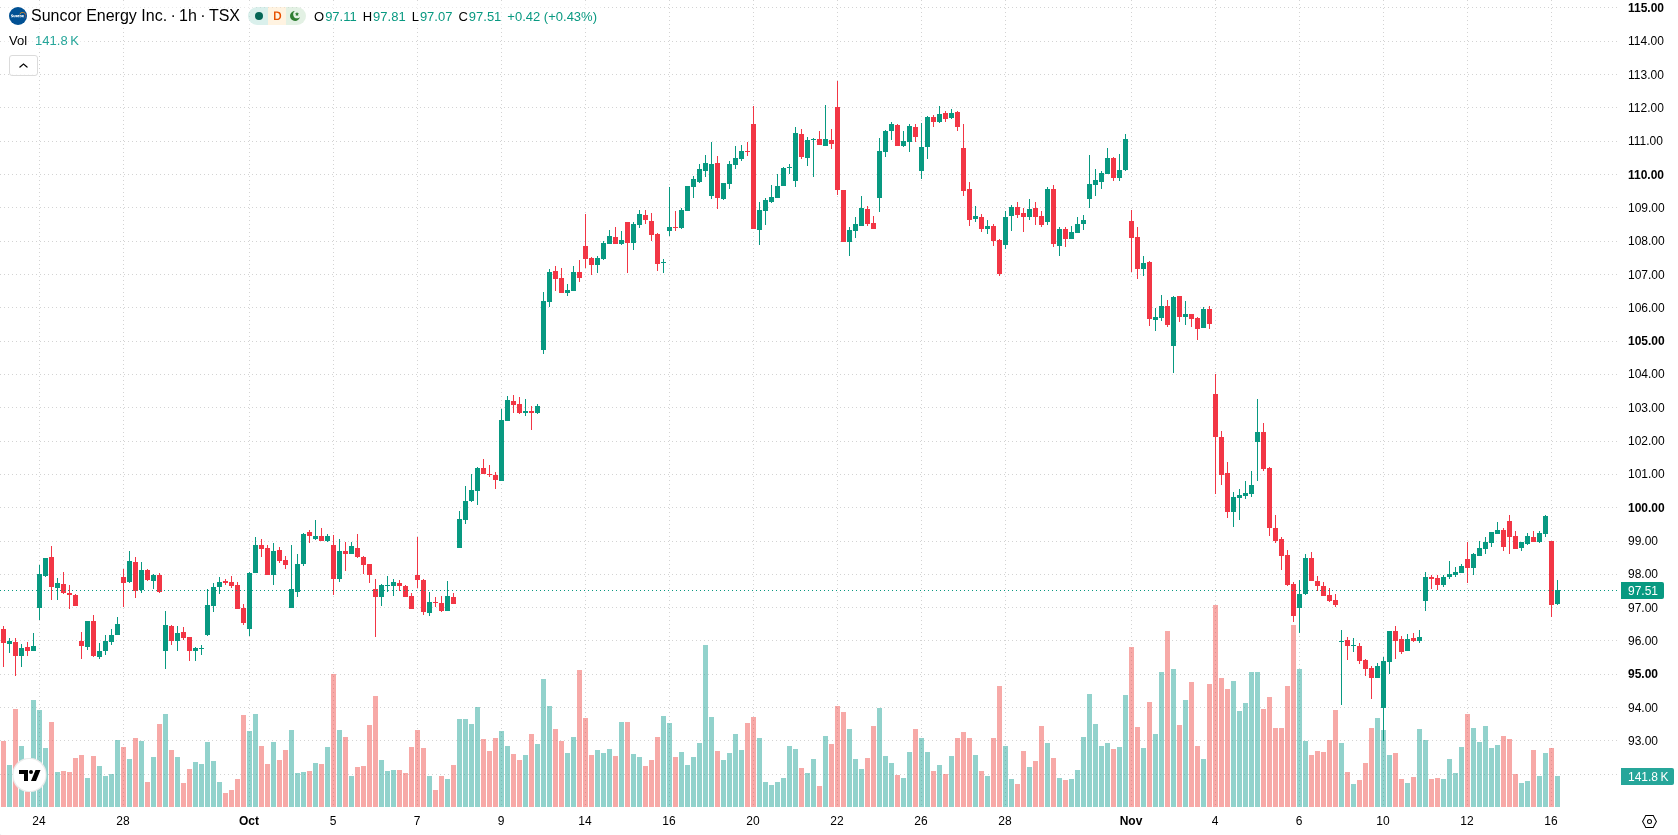
Suncor Energy (SU) stock is trading at C$97.5, down 2.22% for the day. The price sits below its short- and medium-term moving averages, but remains above longer-term trend levels.
 94.17
99.76
Highlights
- Suncor Energy approved a 10% dividend increase to CAD 0.66 per share and raised monthly buybacks to $750 million from October.
- The company carried $1.8 billion in net debt at the end of Q3 and averaged 853,000 barrels per day in upstream production.
- Shares of Suncor Energy slipped 2.22% to C$97.5 with momentum signals positive but technical indicators suggesting a likely short-term pullback within a C$94.46 to C$100.54 range.
Shareholder payouts rise as capital returns outpace price response
Suncor Energy's Board of Directors approved a 10% increase in its quarterly dividend to CAD $0.66 per share for shareholders of record as of December 3, 2026, with payment distributed on December 24 according to Energiesmedia. Alongside the dividend hike, the company raised its monthly share buybacks from $500 million to $750 million beginning in October and returned over $2 billion to shareholders in Q3 through a combination of buybacks and cash dividends. Suncor also reported $1.8 billion in net debt at the end of the third quarter and Q3 upstream production averaging 853,000 barrels per day, as reported by Tipranks. These actions reflect robust capital return and operational output, though price action has remained under broader selling pressure.
Overbought indicators signal correction risk as buyers retain edge
On the technical front, SU is trading below the H1 SMA-20 at C$98.68 and the H1 SMA-50 at C$97.8, but remains above the D1 SMA-200 at C$89.39. The Ichimoku Kijun sits at C$97.61 and currently acts as immediate resistance. MACD and ADX both signal buy conditions, while RSI remains neutral. Stochastic RSI and CCI are both overbought, indicating an elevated risk of near-term correction rather than a confirmed reversal. Bull/Bear Power is mildly positive at 0.79, suggesting buyers maintain some intraday advantage, though mixed signals from oscillators point toward a possible pause or pullback.
Downside favored as volatility band constrains breakout potential
In the short term, SU is expected to trade within a range of C$94.46 to C$100.54, reflecting a typical volatility band relative to current levels. There is an estimated 27% chance of an upside move and a 73% probability of further downside, making additional declines more likely. Baseline scenario envisions the price remaining within this corridor. Should the price break above resistance, momentum could accelerate to the upside, while a move below support would likely open the way for further losses.
Earlier, analysts noted that despite stronger shareholder returns from Suncor Energy persistent selling pressure signaled ongoing short-term downside risks for the stock. With technical signals currently mixed but weighted toward a correction, traders should watch for a sustained move above C$100.54 or below C$94.46 to signal the next directional shift.








-
 Afghanistan
-
 Albania
-
 Algeria
-
 Angola
-
 Argentina
-
 Armenia
-
 Australia
-
 Austria
-
 Azerbaijan
-
 Bahamas
-
 Bahrain
-
 Bangladesh
-
 Belarus
-
 Belgium
-
 Bolivia
-
 Botswana
-
 Brazil
-
 Brunei
-
 Bulgaria
-
 Cambodia
-
 Cameroon
-
 Canada
-
 Chile
-
 China
-
 Colombia
-
 Congo
-
 Costa Rica
-
 Cote d'Ivoire
-
 Croatia
-
 Cuba
-
 Cyprus
-
 Czechia
-
 DR Congo
-
 Denmark
-
 Dominican Republic
-
 Ecuador
-
 Egypt
-
 El Salvador
-
 Estonia
-
 Eswatini
-
 Ethiopia
-
 Finland
-
 France
-
 Georgia
-
 Germany
-
 Ghana
-
 Greece
-
 Haiti
-
 Hong Kong
-
 Hungary
-
 India
-
 Indonesia
-
 Iran, Islamic republic
-
 Iraq
-
 Ireland
-
 Israel
-
 Italy
-
 Jamaica
-
 Japan
-
 Jordan
-
 Kazakhstan
-
 Kenya
-
 Korea
-
 Kuwait
-
 Kyrgyzstan
-
 Laos
-
 Latvia
-
 Lebanon
-
 Lesotho
-
 Libya
-
 Lithuania
-
 Luxembourg
-
 Madagascar
-
 Malaysia
-
 Malta
-
 Mauritius
-
 Mexico
-
 Moldova
-
 Mongolia
-
 Montenegro
-
 Morocco
-
 Mozambique
-
 Myanmar
-
 Namibia
-
 Nepal
-
 Netherlands
-
 New Zealand
-
 Nigeria
-
 North Macedonia
-
 Norway
-
 Oman
-
 Pakistan
-
 Palestine
-
 Panama
-
 Papua New Guinea
-
 Paraguay
-
 Peru
-
 Philippines
-
 Poland
-
 Portugal
-
 Puerto Rico
-
 Qatar
-
 Reunion
-
 Romania
-
 Rwanda
-
 Saudi Arabia
-
 Serbia
-
 Singapore
-
 Slovakia
-
 Slovenia
-
 Somalia
-
 South Africa
-
 Spain
-
 Sri Lanka
-
 Sweden
-
 Switzerland
-
 Syria
-
 Taiwan
-
 Tajikistan
-
 Tanzania
-
 Thailand
-
 Trinidad and Tobago
-
 Tunisia
-
 Turkey
-
 UAE
-
 Uganda
-
 Ukraine
-
 United Kingdom
-
United States
-
 Uruguay
-
 Uzbekistan
-
 Venezuela
-
 Vietnam
-
 Yemen
-
 Zambia
-
 Zimbabwe
- Forex
- Crypto












