

Suncor Energy shares technical analysis: Upward move stalls near C$99.86 resistance

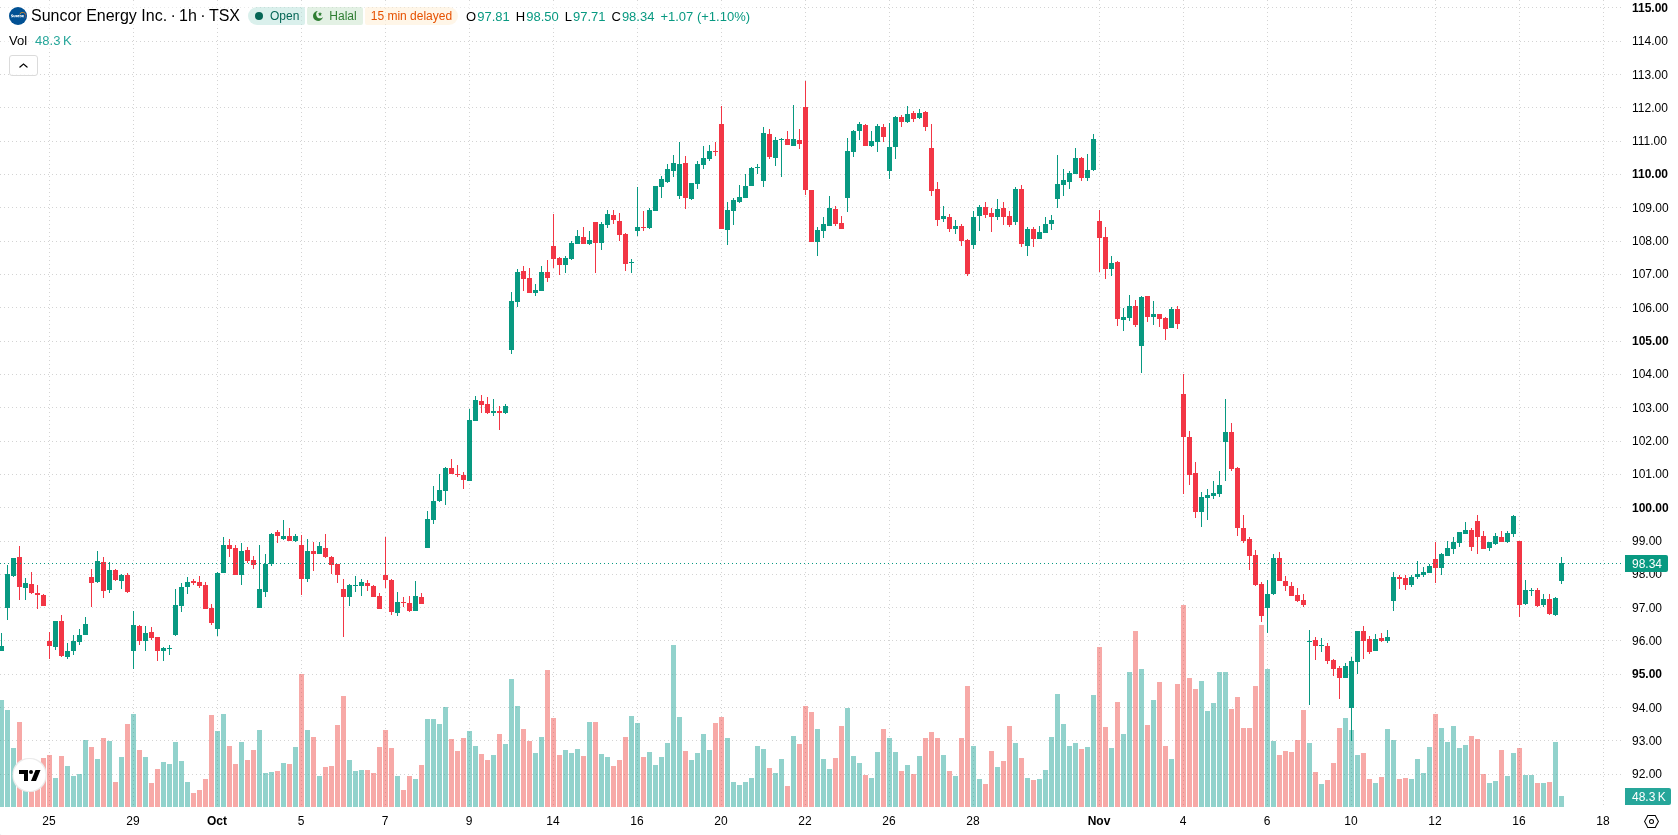
Suncor Energy (SU) stock is trading at C$98.50, marking a daily gain of 1.34%. The price is positioned above its key short-, medium-, and long-term moving averages, indicating near-term strength relative to recent trading levels.
 92.65
99.00
Highlights
- Russell Investments Group purchased 1,898,202 Suncor Energy shares in Q3, indicating significant institutional demand for the stock.
- Intech Investment Management sharply increased its Suncor Energy stake by 147.4%, while Fisher Asset Management exited 812,546 shares during the period.
- Shares of Suncor Energy closed at C$98.5 as technical indicators show a long-term uptrend but short-term weakness, with an expected range of C$96.5 to C$99.86 and a higher probability for downside movement.
Robust institutional accumulation as third-quarter inflows offset outflows
Significant institutional activity in the third quarter has played a role in shaping Suncor Energy's trading environment. Russell Investments Group Ltd. substantially increased its position by purchasing 1,898,202 shares, according to MarketBeat, a move that signals pronounced institutional demand and can directly buoy share price through increased buying interest. Alongside this, Intech Investment Management LLC also sharply raised its stake by 147.4%, reinforcing perceptions of value and liquidity. These inflows were partially offset by Fisher Asset Management LLC's divestment of 812,546 shares, though the overall balance points to robust institutional accumulation in recent reporting periods.
Mixed momentum amid strong technical support and seller exhaustion signals
On the technical front, SU is trading above the H1 SMA-20 at C$98.41, H1 SMA-50 at C$97.44, and the D1 SMA-200 at C$89.52, highlighting the presence of buying momentum across multiple timeframes. The Ichimoku Kijun level at C$98.23 is currently acting as immediate support. Despite these supportive price levels, momentum indicators remain mixed: MACD and ADX both show a sell bias, while RSI presents a neutral stance. Stochastic RSI and CCI are both in oversold zones, indicating potential exhaustion of sellers but not a confirmed reversal, and the Bull/Bear Power reading remains negative, confirming sellers are still active on the intraday horizon.
Downside favored as volatility band constrains near-term price action
Looking ahead, the expected trading range for SU is between C$96.5 and C$99.86 in the coming days, consistent with the typical volatility band relative to current levels. There is a 26% likelihood of a move higher, while a downside scenario is more probable at 74%. The baseline expectation remains for sideways movement within this band. A break above C$99.86 could trigger renewed bullish momentum, while sustained trading below C$96.5 would tilt the bias toward a bearish outcome.
Earlier, analysts noted that Suncor Energy faced ongoing short-term downside risks despite robust shareholder returns and mixed technical signals. The current analysis adds a new dimension by highlighting intensified institutional accumulation, suggesting traders should monitor for a shift in direction if buying momentum persists above prevailing technical support.






Latest Suncor Energy News


-
 Afghanistan
-
 Albania
-
 Algeria
-
 Angola
-
 Argentina
-
 Armenia
-
 Australia
-
 Austria
-
 Azerbaijan
-
 Bahamas
-
 Bahrain
-
 Bangladesh
-
 Belarus
-
 Belgium
-
 Bolivia
-
 Botswana
-
 Brazil
-
 Brunei
-
 Bulgaria
-
 Cambodia
-
 Cameroon
-
 Canada
-
 Chile
-
 China
-
 Colombia
-
 Congo
-
 Costa Rica
-
 Cote d'Ivoire
-
 Croatia
-
 Cuba
-
 Cyprus
-
 Czechia
-
 DR Congo
-
 Denmark
-
 Dominican Republic
-
 Ecuador
-
 Egypt
-
 El Salvador
-
 Estonia
-
 Eswatini
-
 Ethiopia
-
 Finland
-
 France
-
 Georgia
-
 Germany
-
 Ghana
-
 Greece
-
 Haiti
-
 Hong Kong
-
 Hungary
-
 India
-
 Indonesia
-
 Iran, Islamic republic
-
 Iraq
-
 Ireland
-
 Israel
-
 Italy
-
 Jamaica
-
 Japan
-
 Jordan
-
 Kazakhstan
-
 Kenya
-
 Korea
-
 Kuwait
-
 Kyrgyzstan
-
 Laos
-
 Latvia
-
 Lebanon
-
 Lesotho
-
 Libya
-
 Lithuania
-
 Luxembourg
-
 Madagascar
-
 Malaysia
-
 Malta
-
 Mauritius
-
 Mexico
-
 Moldova
-
 Mongolia
-
 Montenegro
-
 Morocco
-
 Mozambique
-
 Myanmar
-
 Namibia
-
 Nepal
-
 Netherlands
-
 New Zealand
-
 Nigeria
-
 North Macedonia
-
 Norway
-
 Oman
-
 Pakistan
-
 Palestine
-
 Panama
-
 Papua New Guinea
-
 Paraguay
-
 Peru
-
 Philippines
-
 Poland
-
 Portugal
-
 Puerto Rico
-
 Qatar
-
 Reunion
-
 Romania
-
 Rwanda
-
 Saudi Arabia
-
 Serbia
-
 Singapore
-
 Slovakia
-
 Slovenia
-
 Somalia
-
 South Africa
-
 Spain
-
 Sri Lanka
-
 Sweden
-
 Switzerland
-
 Syria
-
 Taiwan
-
 Tajikistan
-
 Tanzania
-
 Thailand
-
 Trinidad and Tobago
-
 Tunisia
-
 Turkey
-
 UAE
-
 Uganda
-
 Ukraine
-
 United Kingdom
-
United States
-
 Uruguay
-
 Uzbekistan
-
 Venezuela
-
 Vietnam
-
 Yemen
-
 Zambia
-
 Zimbabwe
- Forex
- Crypto












