

Suncor Energy stock trades flat as seller pressure dominates near key support levels

Suncor Energy (SU) stock is trading at C$91.15 after a modest daily decline, finishing near its session low. The current price is below its key short-term moving averages but remains above long-term support levels.
 92.65
99.00
Highlights
- Suncor Energy reported record Q3 adjusted funds from operations of $6.7 billion and free funds flow of $5.2 billion.
- The company increased its monthly share buybacks to $750 million, raised its quarterly dividend by 10% to C$0.66 per share, and expects $1.2 billion upfront from an East Coast asset sale.
- Shares of Suncor closed at C$91.15, trading below key short- and medium-term averages with downside risk between C$87.93 and C$94.37 as technical indicators remain bearish.
Shareholder returns boosted as record cash inflow drives buybacks
Suncor Energy reported record third-quarter adjusted funds from operations of $6.7 billion and free funds flow of $5.2 billion, demonstrating strong operational cash generation, according to Rallies. The company also raised its monthly share buybacks to $750 million and declared a 10% increase in its quarterly dividend to C$0.66 per share, as noted by Defenseworld, distributing more cash to shareholders. Additionally, a planned sale of East Coast assets to Ithaca Energy is expected to bring in $1.2 billion upfront and streamline Suncor's portfolio. Lowered production growth guidance through 2028 to 60,000 barrels daily further tempers the long-term outlook.
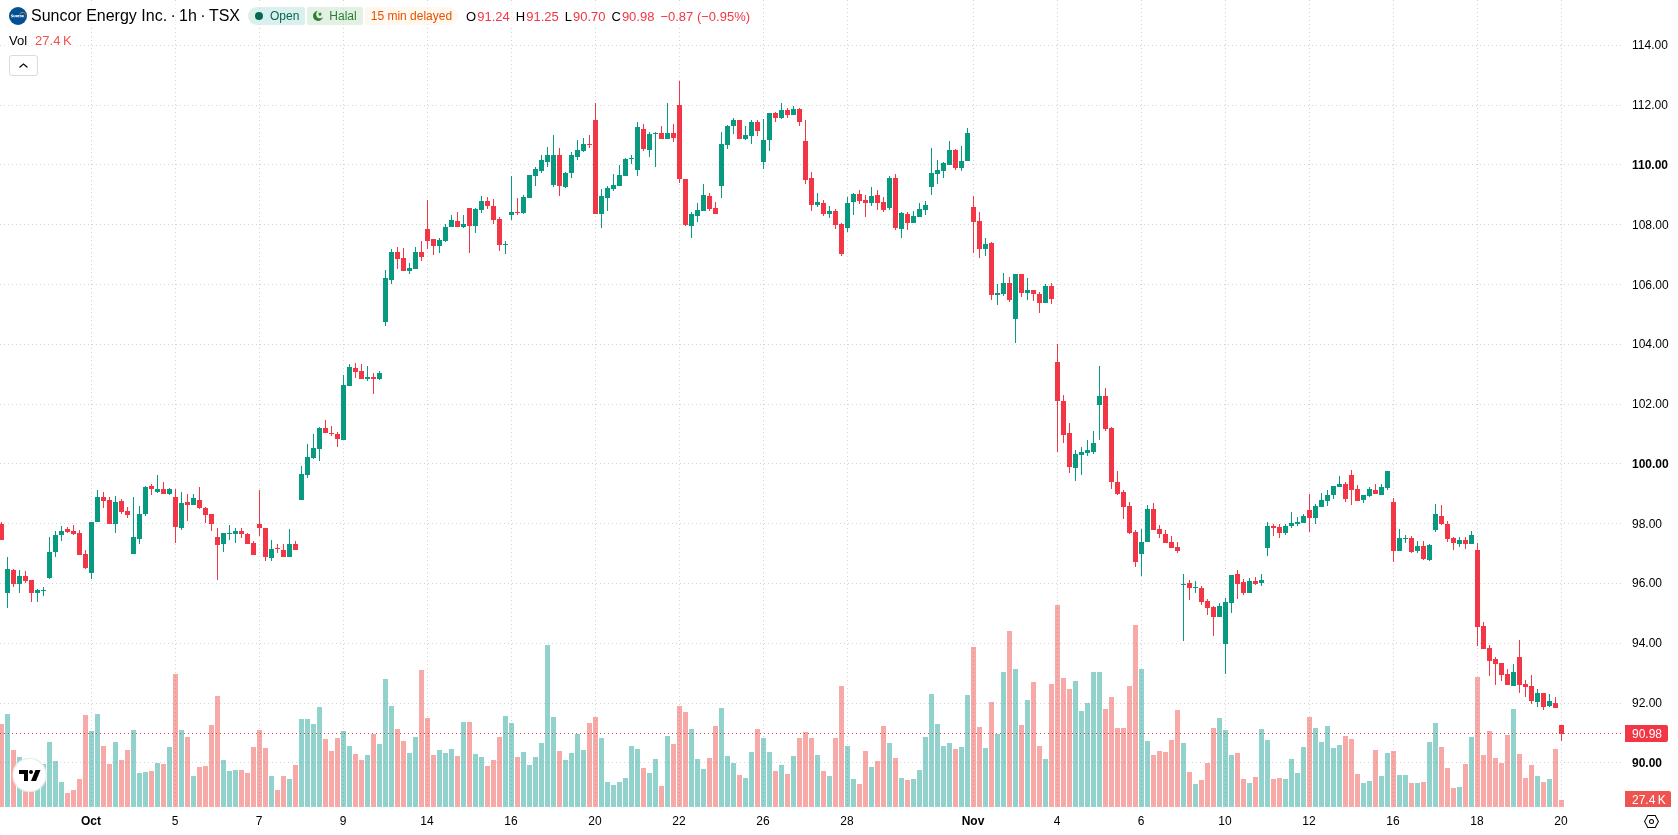
Bearish momentum persists as intraday indicators reinforce selling pressure
On the H1 timeframe, SU is trading below the H1 SMA-20 at C$94.22 and H1 SMA-50 at C$96.62, while remaining above the D1 SMA-200 at C$89.85. The Ichimoku Kijun sits at C$95.23 and acts as immediate resistance. MACD and ADX readings are showing a sell configuration, while RSI is firmly in the oversold zone. Both Stoch RSI and CCI are neutral. Negative Bull/Bear Power at -0.86 points to seller dominance intraday, and the Awesome Oscillator signal remains neutral. Mixed signals arise as the sharp RSI oversold reading contrasts with otherwise bearish momentum indicators, but intraday price action confirms persistent selling pressure.
Downside risk elevated as price stays near volatility channel support
In the near term, SU is likely to trade in a C$87.93 to C$94.37 volatility band relative to current levels. The probability of further upside is very low, while downside risk remains high. The baseline scenario sees SU remaining within this channel. A move above immediate resistance could trigger a bullish scenario, while a break of the support around C$87.93 would signal additional downside.
Earlier, analysts noted that Suncor Energy faced ongoing short-term downside risks, though its strong operational performance supported long-term stability. The current analysis reinforces this outlook and highlights C$87.93 as a critical downside level for traders to monitor.








-
 Afghanistan
-
 Albania
-
 Algeria
-
 Angola
-
 Argentina
-
 Armenia
-
 Australia
-
 Austria
-
 Azerbaijan
-
 Bahamas
-
 Bahrain
-
 Bangladesh
-
 Belarus
-
 Belgium
-
 Bolivia
-
 Botswana
-
 Brazil
-
 Brunei
-
 Bulgaria
-
 Cambodia
-
 Cameroon
-
 Canada
-
 Chile
-
 China
-
 Colombia
-
 Congo
-
 Costa Rica
-
 Cote d'Ivoire
-
 Croatia
-
 Cuba
-
 Cyprus
-
 Czechia
-
 DR Congo
-
 Denmark
-
 Dominican Republic
-
 Ecuador
-
 Egypt
-
 El Salvador
-
 Estonia
-
 Eswatini
-
 Ethiopia
-
 Finland
-
 France
-
 Georgia
-
 Germany
-
 Ghana
-
 Greece
-
 Haiti
-
 Hong Kong
-
 Hungary
-
 India
-
 Indonesia
-
 Iran, Islamic republic
-
 Iraq
-
 Ireland
-
 Israel
-
 Italy
-
 Jamaica
-
 Japan
-
 Jordan
-
 Kazakhstan
-
 Kenya
-
 Korea
-
 Kuwait
-
 Kyrgyzstan
-
 Laos
-
 Latvia
-
 Lebanon
-
 Lesotho
-
 Libya
-
 Lithuania
-
 Luxembourg
-
 Madagascar
-
 Malaysia
-
 Malta
-
 Mauritius
-
 Mexico
-
 Moldova
-
 Mongolia
-
 Montenegro
-
 Morocco
-
 Mozambique
-
 Myanmar
-
 Namibia
-
 Nepal
-
 Netherlands
-
 New Zealand
-
 Nigeria
-
 North Macedonia
-
 Norway
-
 Oman
-
 Pakistan
-
 Palestine
-
 Panama
-
 Papua New Guinea
-
 Paraguay
-
 Peru
-
 Philippines
-
 Poland
-
 Portugal
-
 Puerto Rico
-
 Qatar
-
 Reunion
-
 Romania
-
 Rwanda
-
 Saudi Arabia
-
 Serbia
-
 Singapore
-
 Slovakia
-
 Slovenia
-
 Somalia
-
 South Africa
-
 Spain
-
 Sri Lanka
-
 Sweden
-
 Switzerland
-
 Syria
-
 Taiwan
-
 Tajikistan
-
 Tanzania
-
 Thailand
-
 Trinidad and Tobago
-
 Tunisia
-
 Turkey
-
 UAE
-
 Uganda
-
 Ukraine
-
 United Kingdom
-
United States
-
 Uruguay
-
 Uzbekistan
-
 Venezuela
-
 Vietnam
-
 Yemen
-
 Zambia
-
 Zimbabwe
- Forex
- Crypto












