

Citigroup stock forecast: Price expected to consolidate above $126.30 support under technical pressure

Citigroup (C) stock is trading at $127.35, recording a daily decline of 3.46%. The price is below its key short- and medium-term moving averages, while remaining supported above longer-term levels.
 133.50
132.00
133.50
132.00
Highlights
- Citigroup reported third-quarter earnings per share of $2.85 on revenue of $23.8 billion, beating analyst estimates.
- Net income rose 40% year over year, supported by gains in investment banking, services, and wealth management, as the company returned $4.1 billion to shareholders.
- Shares of Citigroup closed at $127.35, down 3.46%, with technical indicators showing downside pressure and a projected range of $123.86 to $130.84.
Earnings outperformance and shareholder returns offset by regulatory focus
Citigroup reported third-quarter earnings that exceeded Wall Street estimates, with earnings per share of $2.85 and revenue of $23.8 billion, indicating operational outperformance and margin strength relative to consensus. Net income surged 40% year-over-year, supported by strong performance in investment banking, services, and wealth management segments, enhancing the perception of business profitability. Additionally, Citigroup returned $4.1 billion to shareholders through buybacks and dividends, according to Newsquawk, while also submitting documentation to U.S. regulators in an effort to resolve longstanding consent orders and regulatory compliance issues, as noted by Yahoo Finance. These developments reflect a fundamentally constructive news flow, though price action has remained under broader selling pressure.
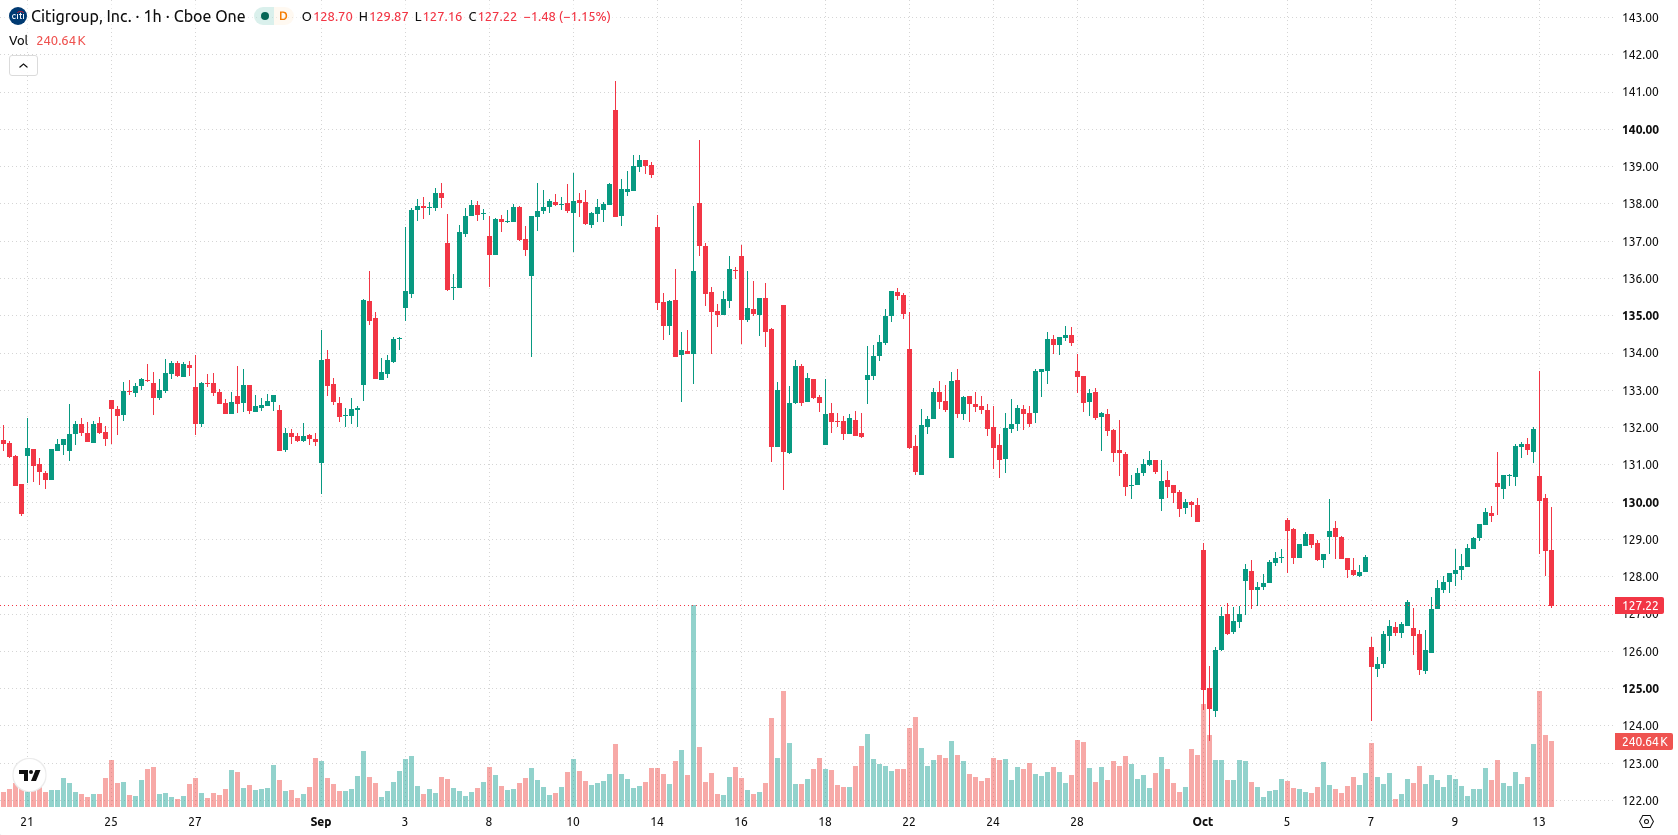
Momentum divergence as positive signals clash with overbought readings
C is trading below the MA-20 and MA-50, reflecting short- and medium-term downside levels, but remains above the MA-200 which now acts as key support. The Ichimoku Kijun is situated at $129.43 and serves as immediate resistance. MACD, ADX, and Awesome Oscillator all indicate positive momentum, while RSI and CCI are currently at overbought readings. At the same time, Stoch RSI signals strong selling pressure, with Bull/Bear Power confirming buyer dominance, highlighting a divergence between positive momentum and overbought oscillators.
Consolidation bias as volatility and downside risk remain elevated
Looking ahead to the next several trading days, C is expected to consolidate within the projected price range of $123.86 to $130.84 under typical volatility conditions. The probability of a further decline stands at 75%, while the chance of a rebound is limited to 25%. Baseline expectations call for rangebound movement, but a breakout above $129.43 could open the way toward upper resistance, whereas a sustained move below $126.3 would likely deepen downside risk.
Earlier, analysts noted that Citi was well-positioned to benefit from improving conditions in digital assets and a shift toward infrastructure-focused business models. Now, with Citigroup demonstrating earnings outperformance and actively addressing regulatory issues, traders should monitor the $129.43 resistance and $126.3 support for signs of a potential breakout in either direction.





Latest Citigroup News




-
 Afghanistan
-
 Albania
-
 Algeria
-
 Angola
-
 Argentina
-
 Armenia
-
 Australia
-
 Austria
-
 Azerbaijan
-
 Bahamas
-
 Bahrain
-
 Bangladesh
-
 Belarus
-
 Belgium
-
 Bolivia
-
 Botswana
-
 Brazil
-
 Brunei
-
 Bulgaria
-
 Cambodia
-
 Cameroon
-
 Canada
-
 Chile
Chile
-
 China
China
-
 Colombia
-
 Congo
Congo
-
 Costa Rica
-
 Cote d'Ivoire
-
 Croatia
-
 Cuba
Cuba
-
 Cyprus
-
 Czechia
-
 DR Congo
-
 Denmark
-
 Dominican Republic
-
 Ecuador
-
 Egypt
Egypt
-
 El Salvador
-
 Estonia
-
 Eswatini
-
 Ethiopia
-
 Finland
-
 France
-
 Georgia
-
 Germany
-
 Ghana
Ghana
-
 Greece
-
 Haiti
Haiti
-
 Hong Kong
-
 Hungary
-
 India
India
-
 Indonesia
-
 Iran, Islamic republic
-
 Iraq
Iraq
-
 Ireland
-
 Israel
-
 Italy
Italy
-
 Jamaica
-
 Japan
Japan
-
 Jordan
-
 Kazakhstan
-
 Kenya
Kenya
-
 Korea
Korea
-
 Kuwait
-
 Kyrgyzstan
-
 Laos
Laos
-
 Latvia
-
 Lebanon
-
 Lesotho
-
 Libya
Libya
-
 Lithuania
-
 Luxembourg
-
 Madagascar
-
 Malaysia
-
 Malta
Malta
-
 Mauritius
-
 Mexico
-
 Moldova
-
 Mongolia
-
 Montenegro
-
 Morocco
-
 Mozambique
-
 Myanmar
-
 Namibia
-
 Nepal
Nepal
-
 Netherlands
-
 New Zealand
-
 Nigeria
-
 North Macedonia
-
 Norway
-
 Oman
Oman
-
 Pakistan
-
 Palestine
-
 Panama
-
 Papua New Guinea
-
 Paraguay
-
 Peru
Peru
-
 Philippines
-
 Poland
-
 Portugal
-
 Puerto Rico
-
 Qatar
Qatar
-
 Reunion
-
 Romania
-
 Rwanda
-
 Saudi Arabia
-
 Serbia
-
 Singapore
-
 Slovakia
-
 Slovenia
-
 Somalia
-
 South Africa
-
 Spain
Spain
-
 Sri Lanka
-
 Sweden
-
 Switzerland
-
 Syria
Syria
-
 Taiwan
-
 Tajikistan
-
 Tanzania
-
 Thailand
-
 Trinidad and Tobago
-
 Tunisia
-
 Turkey
-
 UAE
UAE
-
 Uganda
-
 Ukraine
-
 United Kingdom
-
United States
-
 Uruguay
-
 Uzbekistan
-
 Venezuela
-
 Vietnam
-
 Yemen
Yemen
-
 Zambia
-
 Zimbabwe
- Forex
- Crypto












