

Abbott stock tests pivotal support at $101.82 with mixed technical signals: weekly analysis

Shares of Abbott Laboratories (ABT) are trading near $102 after gaining about 2.6% this week. The chart reflects a rally that has run into overbought conditions, with mixed momentum signals now setting up a tension between potential continuation and pullback. This push and pull is likely to define the tone heading into the next week.
 105.88
105.88
105.88
Highlights
- Shares of Abbott gained 2.57% over the past week but remain below both the 50-day and 200-day moving averages.
- Key technical signals are mixed, with momentum indicators split and Stochastic RSI showing the stock is overbought.
- Trading is expected between $99.23 and $104.76 in the next five days, anchored by support at $101.82 and resistance at $103.12.
Product launches and FDA approvals drive growth outlook and bolster sentiment
Abbott advanced its product lineup with the launch of Ensure Max Protein 3-in-1 Muscle Support, targeting performance-focused consumers, according to Yahoo Finance. The company also began U.S. commercialization of the SimpleScreen CRC blood-based colorectal cancer screening test and gained FDA approval for expanded CardioMEMS HF System app capabilities, as reported by Simply Wall St. These moves reinforce ABT’s focus on growth across its nutrition, diagnostics, and medical devices businesses, while its longstanding dividend record continues to attract income-oriented investors (source: Simply Wall St). The next scheduled event is ABT’s third-quarter 2026 earnings report on October 21, with analysts expecting year-over-year gains in earnings and revenue, TradingView noted.
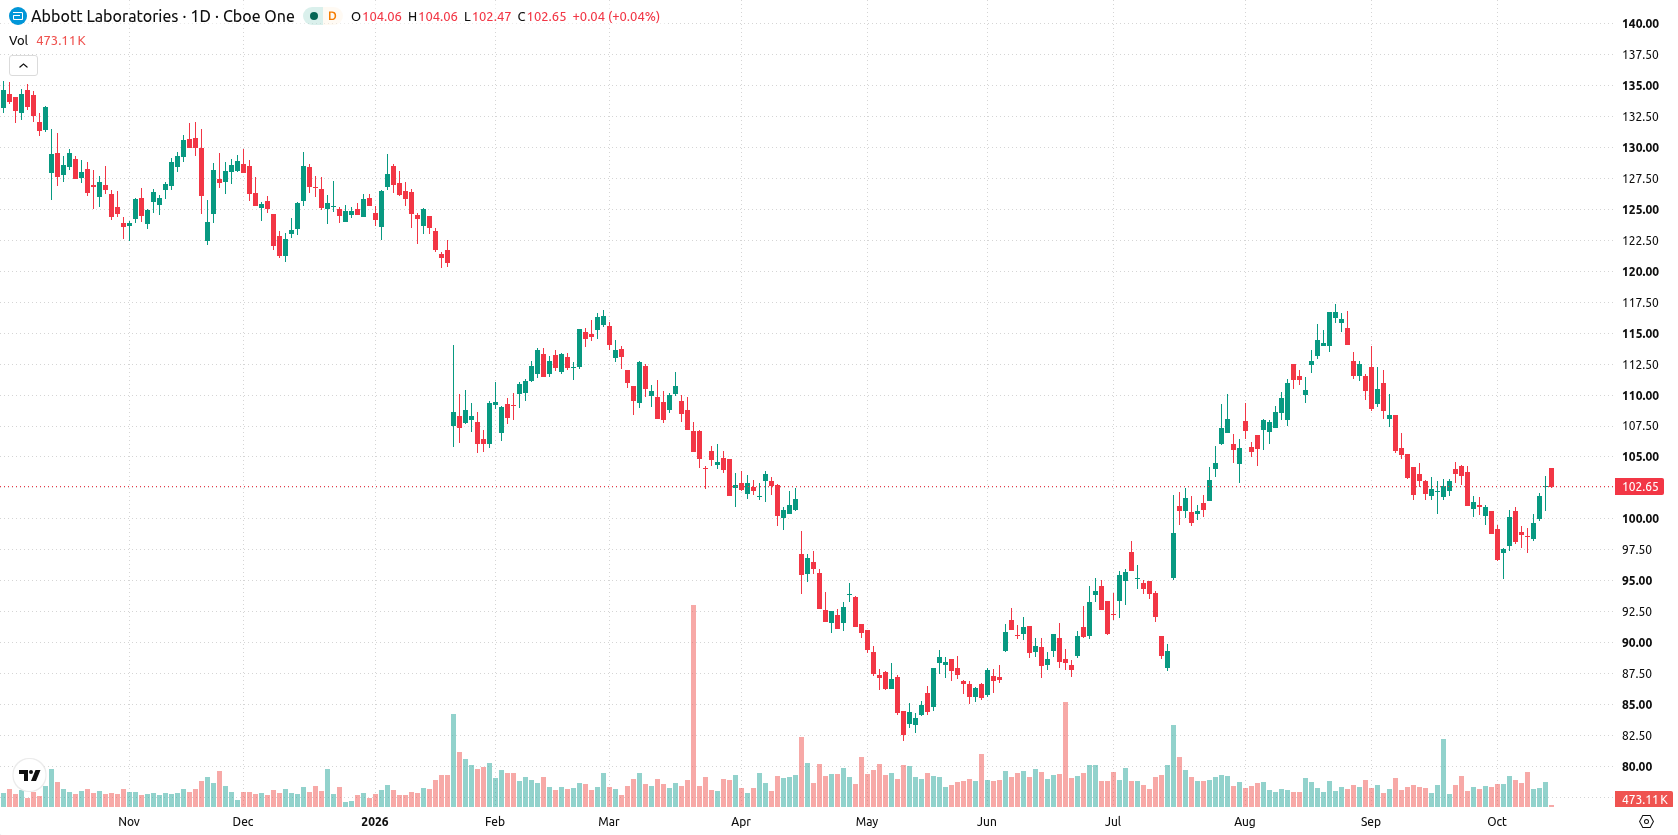
Volatility rises as momentum indicators give conflicting technical signals
On the daily chart, structure remains in flux as volatility reached 6.37% this week and the move higher shows an emerging character that is not yet confirmed. Momentum signals offer mixed messages, with the MACD pointing to continued selling while ADX at 20.44 suggests a possible upward trend, and the Stochastic RSI is firmly overbought at 100. Immediate support is provided by the Ichimoku Kijun at $101.82, which the stock is currently holding, while resistance is defined by the MA-200 at $103.12. These nearby levels are likely to determine direction in the days ahead.
Upside bias prevails this week with pivotal range defined by key levels
Over the next five trading days, the expected range for Abbott is $99.23 to $104.76. There is a 62% probability of an increase and a 38% probability of a decrease. The base case is for the stock to fluctuate between support at $101.82 and resistance at $103.12. Should price break above $103.12, a retest of the $104.76 upper boundary is in view. If support at $101.82 fails, a decline toward the $99.23 lower edge of the forecast range becomes likely.
Earlier, analysts noted that Abbott's upward moves had been constrained by persistent resistance despite positive product developments, with technical momentum remaining mixed. The current setup maintains this cautious outlook, as ongoing volatility and overbought signals mean traders should closely monitor the $101.82-$103.12 range for signs of a sustained directional breakout or breakdown.








-
 Afghanistan
-
 Albania
-
 Algeria
-
 Angola
-
 Argentina
-
 Armenia
-
 Australia
-
 Austria
-
 Azerbaijan
-
 Bahamas
-
 Bahrain
-
 Bangladesh
-
 Belarus
-
 Belgium
-
 Bolivia
-
 Botswana
-
 Brazil
-
 Brunei
-
 Bulgaria
-
 Cambodia
-
 Cameroon
-
 Canada
-
 Chile
Chile
-
 China
China
-
 Colombia
-
 Congo
Congo
-
 Costa Rica
-
 Cote d'Ivoire
-
 Croatia
-
 Cuba
Cuba
-
 Cyprus
-
 Czechia
-
 DR Congo
-
 Denmark
-
 Dominican Republic
-
 Ecuador
-
 Egypt
Egypt
-
 El Salvador
-
 Estonia
-
 Eswatini
-
 Ethiopia
-
 Finland
-
 France
-
 Georgia
-
 Germany
-
 Ghana
Ghana
-
 Greece
-
 Haiti
Haiti
-
 Hong Kong
-
 Hungary
-
 India
India
-
 Indonesia
-
 Iran, Islamic republic
-
 Iraq
Iraq
-
 Ireland
-
 Israel
-
 Italy
Italy
-
 Jamaica
-
 Japan
Japan
-
 Jordan
-
 Kazakhstan
-
 Kenya
Kenya
-
 Korea
Korea
-
 Kuwait
-
 Kyrgyzstan
-
 Laos
Laos
-
 Latvia
-
 Lebanon
-
 Lesotho
-
 Libya
Libya
-
 Lithuania
-
 Luxembourg
-
 Madagascar
-
 Malaysia
-
 Malta
Malta
-
 Mauritius
-
 Mexico
-
 Moldova
-
 Mongolia
-
 Montenegro
-
 Morocco
-
 Mozambique
-
 Myanmar
-
 Namibia
-
 Nepal
Nepal
-
 Netherlands
-
 New Zealand
-
 Nigeria
-
 North Macedonia
-
 Norway
-
 Oman
Oman
-
 Pakistan
-
 Palestine
-
 Panama
-
 Papua New Guinea
-
 Paraguay
-
 Peru
Peru
-
 Philippines
-
 Poland
-
 Portugal
-
 Puerto Rico
-
 Qatar
Qatar
-
 Reunion
-
 Romania
-
 Rwanda
-
 Saudi Arabia
-
 Serbia
-
 Singapore
-
 Slovakia
-
 Slovenia
-
 Somalia
-
 South Africa
-
 Spain
Spain
-
 Sri Lanka
-
 Sweden
-
 Switzerland
-
 Syria
Syria
-
 Taiwan
-
 Tajikistan
-
 Tanzania
-
 Thailand
-
 Trinidad and Tobago
-
 Tunisia
-
 Turkey
-
 UAE
UAE
-
 Uganda
-
 Ukraine
-
 United Kingdom
-
United States
-
 Uruguay
-
 Uzbekistan
-
 Venezuela
-
 Vietnam
-
 Yemen
Yemen
-
 Zambia
-
 Zimbabwe
- Forex
- Crypto












