

Morgan Stanley stock trades lower as sellers dominate near $177.24 support

Morgan Stanley (MS) stock is trading at $180.38, marking a daily decline of 3.35%. The stock is positioned below its key moving averages, indicating continued downward momentum.
 184.83
193.19
184.83
193.19
Highlights
- Morgan Stanley reported third-quarter earnings of $3.03 per share and revenue of $20.34 billion, both above consensus forecasts.
- Equity trading and record Wealth Management results bolstered revenue, while investment banking revenue rose 2% year-over-year but missed expectations.
- Shares of Morgan Stanley trade below key moving averages as technical signals remain decisively bearish, with price expected to consolidate between $177.24 and $183.52.
Mixed earnings outperformance as lingering pessimism tempers investor response
Morgan Stanley reported third-quarter earnings of $3.03 per share, surpassing consensus forecasts, according to Benzinga. Revenue for the quarter reached $20.34 billion, ahead of projections and supported by strength in equity trading and record Wealth Management results. Additional data from MarketBeat indicated a 19.31% return on equity and a net margin of 15.65%, while CNBC noted that investment banking revenue rose 2% year-over-year but fell short of expectations, offering mixed signals for the stock though price action has remained under broader selling pressure.
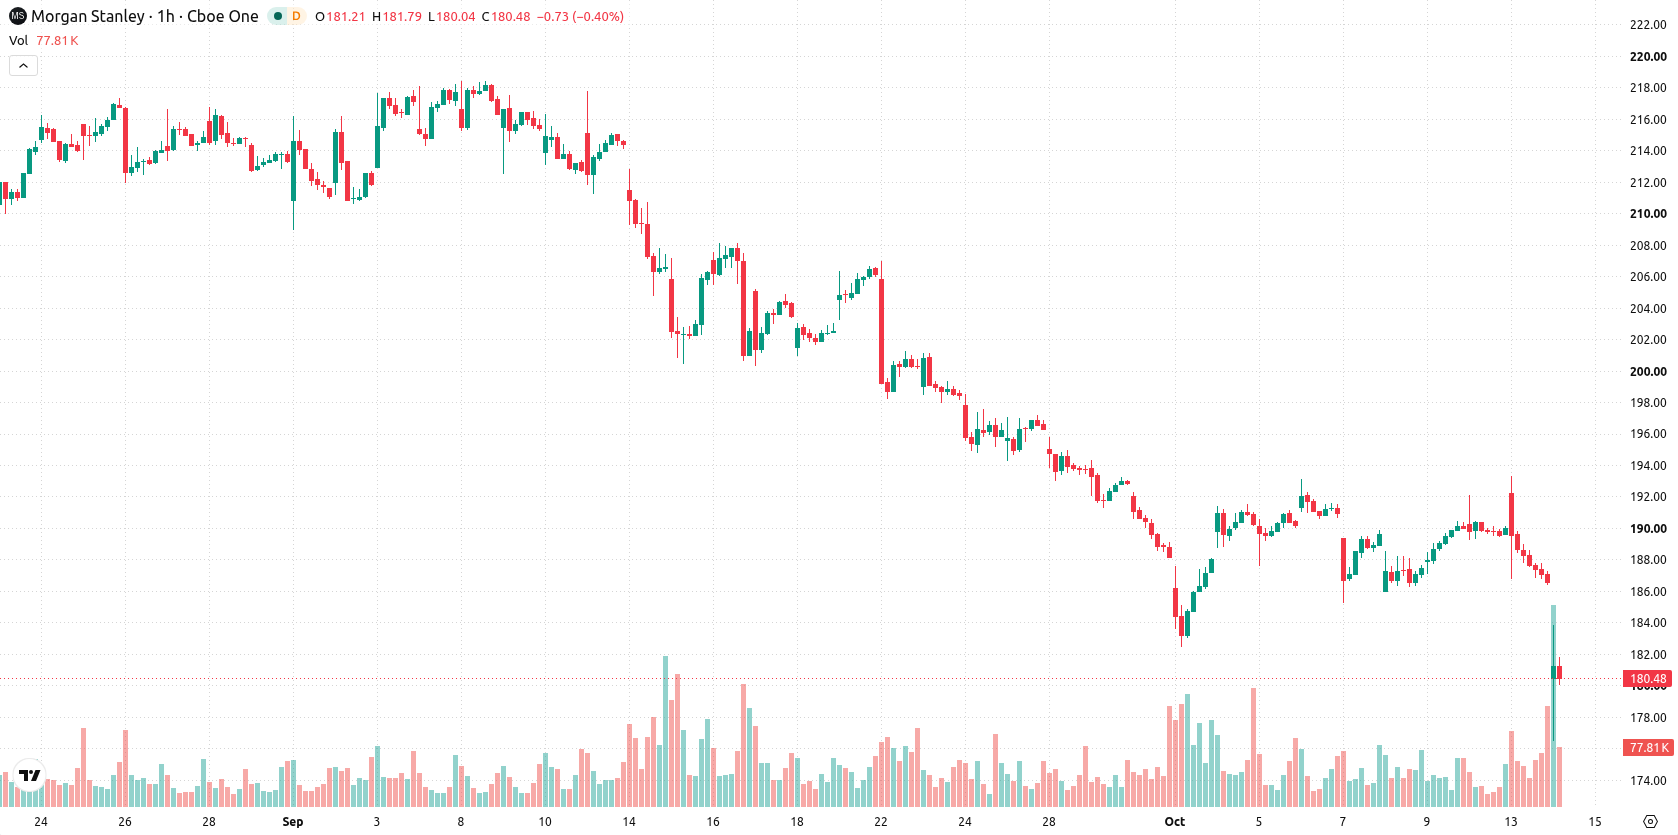
Bearish signals deepen as sellers dominate key technical levels
On the hourly chart, MS is trading below the MA-20 at $188.63, the MA-50 at $188.96, and the long-term MA-200 at $194.29. The Ichimoku Kijun is set at $186.33 and now functions as immediate resistance. Technical indicators are firmly bearish: MACD and ADX both confirm a sell bias, RSI is at 15.41 indicating extreme oversold conditions, and both Stoch RSI and CCI are deeply oversold without signaling a reversal. Bull/Bear Power remains negative intraday, and the Awesome Oscillator also points to persistent seller dominance.
Rangebound trading likely as bearish risks outweigh rebound prospects
In the short term, price is expected to trade within a corridor between $177.24 and $183.52, representing a volatility band relative to current levels. The probability of an upward move is estimated at 22%, with a downward move more likely at 78%. The baseline scenario anticipates consolidation within this defined range. A clear bullish scenario would require a breakout above immediate resistance at $186.33, while a bearish extension could unfold if support at $177.24 is breached.
Previously it was reported that Morgan Stanley delivered robust third-quarter earnings driven by strong equity trading and record wealth management inflows, despite uneven performance in other segments. The current technical outlook now suggests increased downside risk, making the $177.24 support level critical for short-term positioning as the stock tests the lower bound of its volatility corridor.





Latest Morgan Stanley News





-
 Afghanistan
-
 Albania
-
 Algeria
-
 Angola
-
 Argentina
-
 Armenia
-
 Australia
-
 Austria
-
 Azerbaijan
-
 Bahamas
-
 Bahrain
-
 Bangladesh
-
 Belarus
-
 Belgium
-
 Bolivia
-
 Botswana
-
 Brazil
-
 Brunei
-
 Bulgaria
-
 Cambodia
-
 Cameroon
-
 Canada
-
 Chile
Chile
-
 China
China
-
 Colombia
-
 Congo
Congo
-
 Costa Rica
-
 Cote d'Ivoire
-
 Croatia
-
 Cuba
Cuba
-
 Cyprus
-
 Czechia
-
 DR Congo
-
 Denmark
-
 Dominican Republic
-
 Ecuador
-
 Egypt
Egypt
-
 El Salvador
-
 Estonia
-
 Eswatini
-
 Ethiopia
-
 Finland
-
 France
-
 Georgia
-
 Germany
-
 Ghana
Ghana
-
 Greece
-
 Haiti
Haiti
-
 Hong Kong
-
 Hungary
-
 India
India
-
 Indonesia
-
 Iran, Islamic republic
-
 Iraq
Iraq
-
 Ireland
-
 Israel
-
 Italy
Italy
-
 Jamaica
-
 Japan
Japan
-
 Jordan
-
 Kazakhstan
-
 Kenya
Kenya
-
 Korea
Korea
-
 Kuwait
-
 Kyrgyzstan
-
 Laos
Laos
-
 Latvia
-
 Lebanon
-
 Lesotho
-
 Libya
Libya
-
 Lithuania
-
 Luxembourg
-
 Madagascar
-
 Malaysia
-
 Malta
Malta
-
 Mauritius
-
 Mexico
-
 Moldova
-
 Mongolia
-
 Montenegro
-
 Morocco
-
 Mozambique
-
 Myanmar
-
 Namibia
-
 Nepal
Nepal
-
 Netherlands
-
 New Zealand
-
 Nigeria
-
 North Macedonia
-
 Norway
-
 Oman
Oman
-
 Pakistan
-
 Palestine
-
 Panama
-
 Papua New Guinea
-
 Paraguay
-
 Peru
Peru
-
 Philippines
-
 Poland
-
 Portugal
-
 Puerto Rico
-
 Qatar
Qatar
-
 Reunion
-
 Romania
-
 Rwanda
-
 Saudi Arabia
-
 Serbia
-
 Singapore
-
 Slovakia
-
 Slovenia
-
 Somalia
-
 South Africa
-
 Spain
Spain
-
 Sri Lanka
-
 Sweden
-
 Switzerland
-
 Syria
Syria
-
 Taiwan
-
 Tajikistan
-
 Tanzania
-
 Thailand
-
 Trinidad and Tobago
-
 Tunisia
-
 Turkey
-
 UAE
UAE
-
 Uganda
-
 Ukraine
-
 United Kingdom
-
United States
-
 Uruguay
-
 Uzbekistan
-
 Venezuela
-
 Vietnam
-
 Yemen
Yemen
-
 Zambia
-
 Zimbabwe
- Forex
- Crypto












