

What's behind Goldman Sachs's latest 2.5% stock pullback?

Goldman Sachs Group, Inc. (GS) dropped 2.47% as heavy selling pressure continued despite Q3 2026 seeing one of the firm's strongest earnings reports on record. The decline is supported by the stock trading below all major moving averages and clear signals of ongoing bearish momentum.
 907.36
912.09
Highlights
- Goldman Sachs reported $18.68 billion in quarterly net revenue and $5.29 billion in net earnings, with earnings per share up 39%.
- Equities trading revenue rose 72%, while asset and wealth management revenues reached new records for the firm.
- Shares of Goldman Sachs trade below key moving averages with strong selling pressure, and the five-day expected range is $852.8 to $887.5, with a high probability of a move lower.
Record revenues and shareholder payouts offset by persistent selloff
Goldman Sachs Group, Inc. reported its second-highest quarterly net revenues ever in Q3 2026, with net revenues of $18.68 billion and net earnings of $5.29 billion. Earnings per share reached $17.01, up 39% over the prior year, and the company posted an annualized return on common equity of 18.7%. Equities trading revenue surged 72%, with asset and wealth management revenues also setting new records. The company returned $4.5 billion to shareholders through buybacks and dividends, though price action has remained under broader selling pressure.
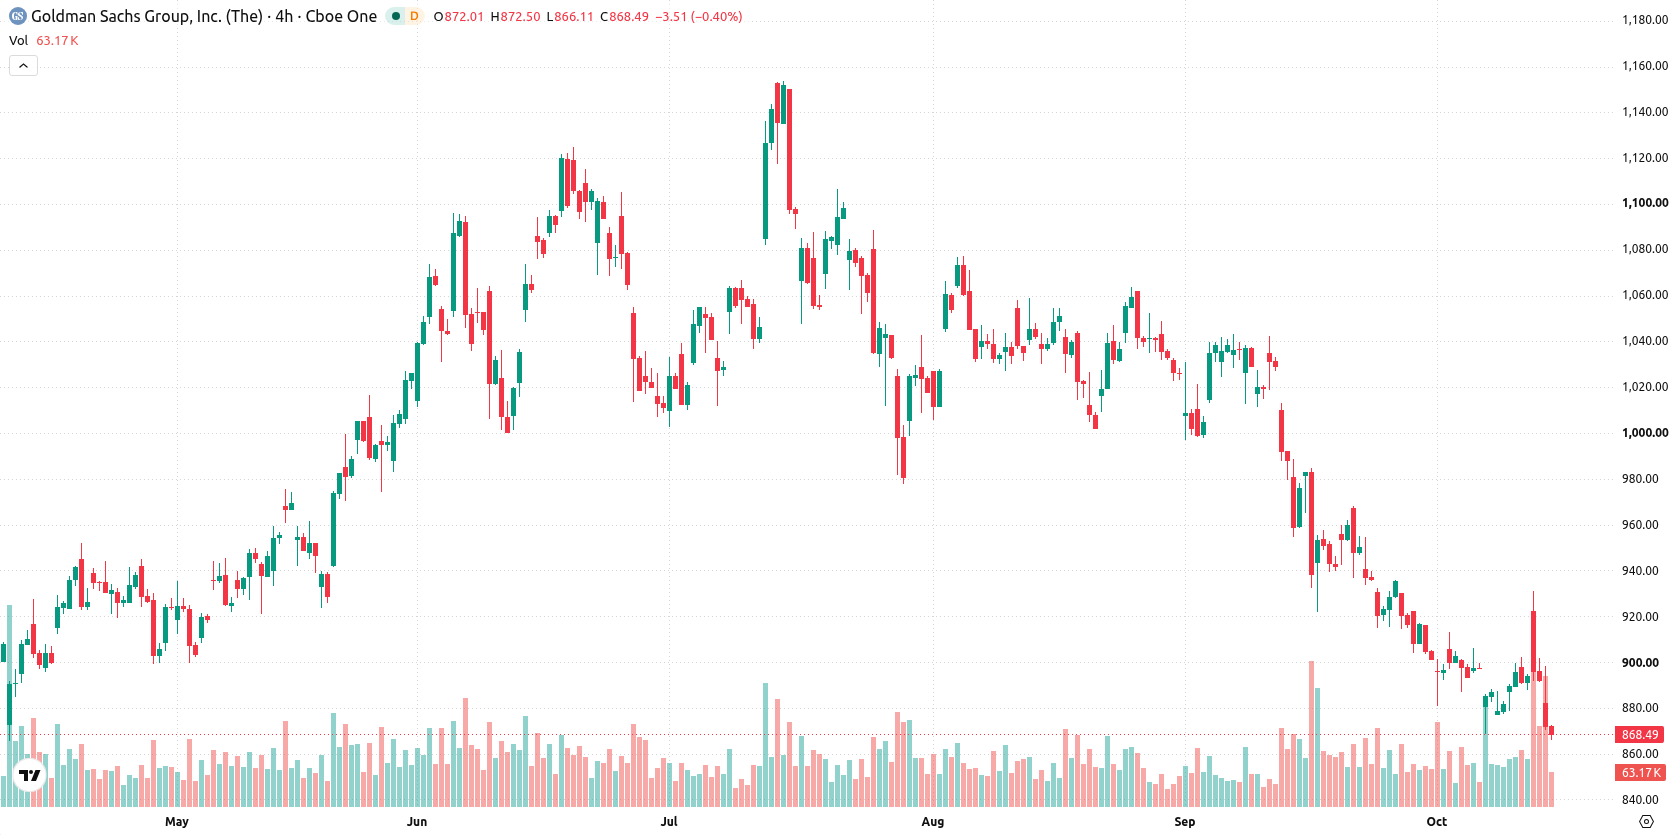
Bearish signals dominate as support holds and intraday volatility rises
GS is trading below its 20-day, 50-day, and 200-day moving averages ($915.54, $984.8, $959.78), reflecting persistent seller control across all timeframes. Immediate resistance appears at $877.39, and support is established at $852.8. Although the medium- to long-term trend remains bullish with the MA-50 above the MA-200, momentum indicators, including MACD and ADX, reveal strong selling pressure. The RSI stands at 34.5, confirming a 'Sell' bias, with the CCI also indicating bearish sentiment. Bull/Bear Power is positive, suggesting intraday buying strength, but is flagged as 'Overbought.' The stock is sharply lower at $870.15 after opening with a strong upside gap, and volatility remains elevated at 2.31%. Weak price action and negative technical momentum point toward continued near-term weakness, though oscillators such as the Stochastic RSI and Awesome Oscillator show more neutral intraday signals.
Previously it was reported that technical analysis pointed to ongoing bearish momentum for Goldman Sachs despite strong quarterly earnings and record trading revenues. The current article strengthens this view, noting persistent downside risk as GS remains under pressure, with the $852.8 support level emerging as a critical threshold to monitor in the week ahead.





Latest Goldman Sachs News





-
 Afghanistan
-
 Albania
-
 Algeria
-
 Angola
-
 Argentina
-
 Armenia
-
 Australia
-
 Austria
-
 Azerbaijan
-
 Bahamas
-
 Bahrain
-
 Bangladesh
-
 Belarus
-
 Belgium
-
 Bolivia
-
 Botswana
-
 Brazil
-
 Brunei
-
 Bulgaria
-
 Cambodia
-
 Cameroon
-
 Canada
-
 Chile
-
 China
-
 Colombia
-
 Congo
-
 Costa Rica
-
 Cote d'Ivoire
-
 Croatia
-
 Cuba
-
 Cyprus
-
 Czechia
-
 DR Congo
-
 Denmark
-
 Dominican Republic
-
 Ecuador
-
 Egypt
-
 El Salvador
-
 Estonia
-
 Eswatini
-
 Ethiopia
-
 Finland
-
 France
-
 Georgia
-
 Germany
-
 Ghana
-
 Greece
-
 Haiti
-
 Hong Kong
-
 Hungary
-
 India
-
 Indonesia
-
 Iran, Islamic republic
-
 Iraq
-
 Ireland
-
 Israel
-
 Italy
-
 Jamaica
-
 Japan
-
 Jordan
-
 Kazakhstan
-
 Kenya
-
 Korea
-
 Kuwait
-
 Kyrgyzstan
-
 Laos
-
 Latvia
-
 Lebanon
-
 Lesotho
-
 Libya
-
 Lithuania
-
 Luxembourg
-
 Madagascar
-
 Malaysia
-
 Malta
-
 Mauritius
-
 Mexico
-
 Moldova
-
 Mongolia
-
 Montenegro
-
 Morocco
-
 Mozambique
-
 Myanmar
-
 Namibia
-
 Nepal
-
 Netherlands
-
 New Zealand
-
 Nigeria
-
 North Macedonia
-
 Norway
-
 Oman
-
 Pakistan
-
 Palestine
-
 Panama
-
 Papua New Guinea
-
 Paraguay
-
 Peru
-
 Philippines
-
 Poland
-
 Portugal
-
 Puerto Rico
-
 Qatar
-
 Reunion
-
 Romania
-
 Rwanda
-
 Saudi Arabia
-
 Serbia
-
 Singapore
-
 Slovakia
-
 Slovenia
-
 Somalia
-
 South Africa
-
 Spain
-
 Sri Lanka
-
 Sweden
-
 Switzerland
-
 Syria
-
 Taiwan
-
 Tajikistan
-
 Tanzania
-
 Thailand
-
 Trinidad and Tobago
-
 Tunisia
-
 Turkey
-
 UAE
-
 Uganda
-
 Ukraine
-
 United Kingdom
-
United States
-
 Uruguay
-
 Uzbekistan
-
 Venezuela
-
 Vietnam
-
 Yemen
-
 Zambia
-
 Zimbabwe
- Forex
- Crypto












