

Walmart shares technical analysis: Upward price move as buyer support strengthens intraday

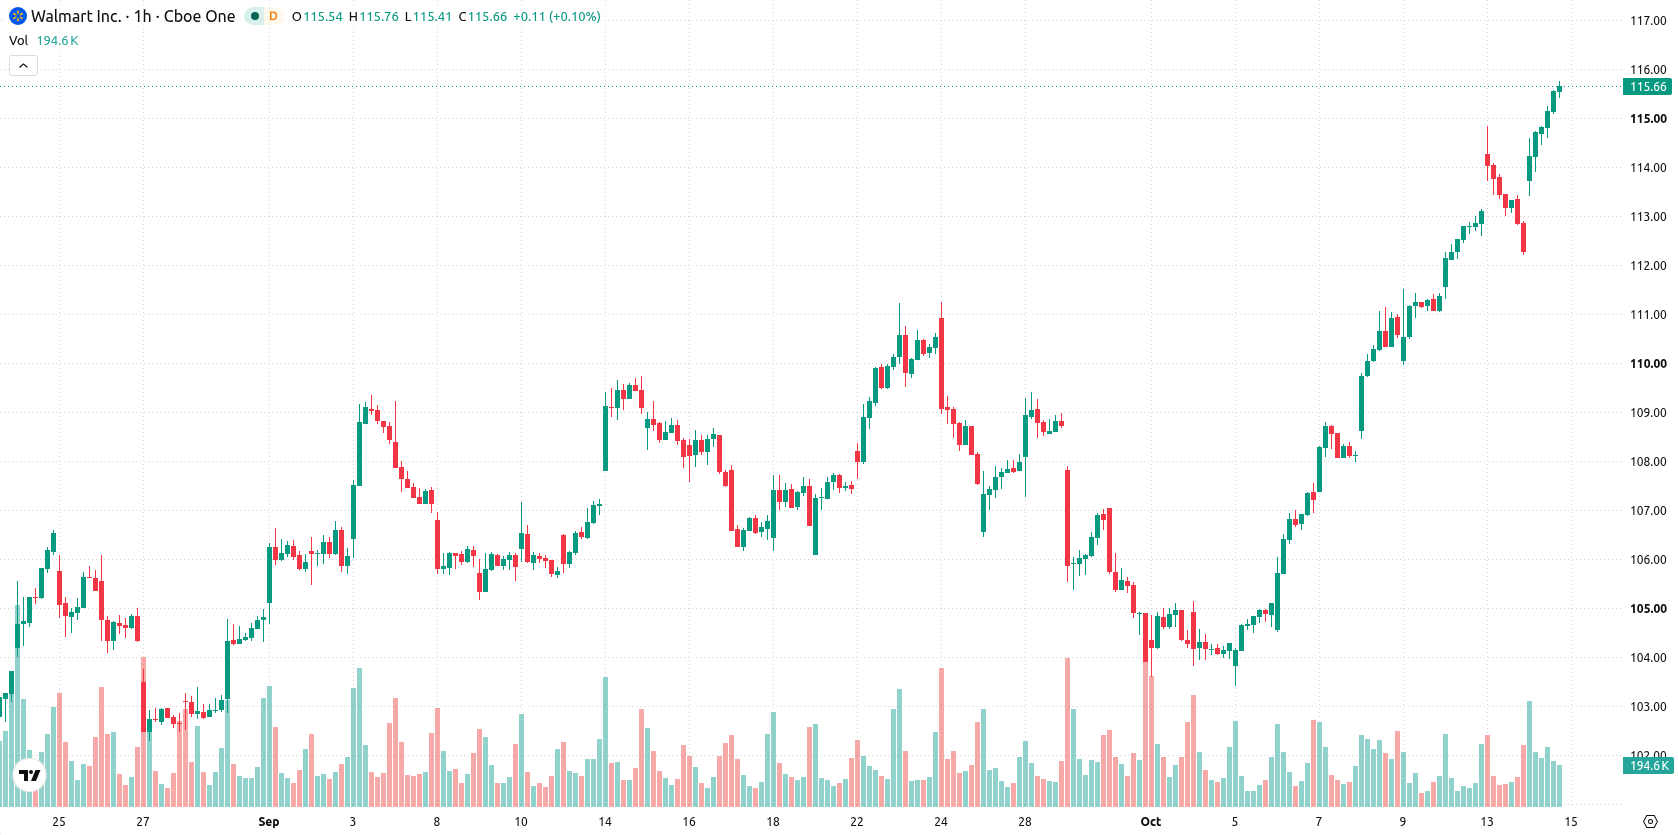
Walmart (WMT) stock is trading at $115.68, up 3.03% on the day. The price sits above its key moving averages on the short- and medium-term timeframes, while remaining below its long-term daily average.
 119.38
121.22
Highlights
- Walmart expanded healthcare benefits for staff in 2024, adding over 250 free prescription drugs including GLP-1s and insulin.
- The FDA sent Walmart a warning about marketing unapproved STI drug products on its website, indicating regulatory scrutiny of its health offerings.
- Walmart stock traded with strong short- and medium-term momentum, finishing up 3.03% and projected to consolidate in a $110.94 to $118.38 range.
Benefit expansions, FDA scrutiny, and automation shape sentiment
Walmart has expanded its employee healthcare benefits for 2024, offering more than 250 prescription medications—including GLP-1s, insulin, and inhalers—at no cost to eligible employees, a move reported by CNBC that may reduce employee turnover and aid cost management. Separately, the U.S. FDA issued Walmart a warning letter for marketing unapproved and misbranded sexually transmitted infection drug products on its website, signaling regulatory oversight of its health marketplace, according to Simplywall. Walmart also opened its fifth next-generation fulfillment center in Stockton, California, an automation-driven facility expected to employ about 1,000 people, according to Yahoo Finance, while recent insider selling by Executive Vice President Daniel Bartlett was disclosed by Investing.com.
Bullish momentum builds as overbought signals test resistance
On the charts, WMT/USD is trading above its MA-20 and MA-50 on the hourly timeframe, but stays below the MA-200 on the daily chart. The Ichimoku Kijun at $112.67 offers immediate support. Momentum indicators are strongly positive, with MACD rated Strong Buy and ADX pointing to bullish conditions. RSI is high at 74.65, with both Stoch RSI and CCI indicating overbought levels, while Bull/Bear Power shows buyers dominating intraday trading. The Awesome Oscillator is neutral and does not confirm the short-term trend.
Consolidation outlook holds with breakouts poised to shift momentum
Over the coming sessions, the expected price range is $110.94 to $118.38. The probability of an upward move is very high, and a decline appears unlikely. The baseline scenario calls for price consolidation within this band, though a break above $118.38 could trigger renewed buying and upward momentum. Conversely, a move below $110.94 would expose the market to further downside pressure.
Earlier, analysts noted that rising freight and input costs were driving renewed pricing pressures across the U.S. grocery sector, with companies like Walmart working to offset inflation while maintaining affordability. In light of Walmart's latest operational investments and healthcare benefit expansions, the prevailing scenario suggests traders should keep an eye on price action around the $118.38 level, as any breakout could trigger new momentum beyond the current consolidation range.





Latest Walmart News





-
 Afghanistan
-
 Albania
-
 Algeria
-
 Angola
-
 Argentina
-
 Armenia
-
 Australia
-
 Austria
-
 Azerbaijan
-
 Bahamas
-
 Bahrain
-
 Bangladesh
-
 Belarus
-
 Belgium
-
 Bolivia
-
 Botswana
-
 Brazil
-
 Brunei
-
 Bulgaria
-
 Cambodia
-
 Cameroon
-
 Canada
-
 Chile
-
 China
-
 Colombia
-
 Congo
-
 Costa Rica
-
 Cote d'Ivoire
-
 Croatia
-
 Cuba
-
 Cyprus
-
 Czechia
-
 DR Congo
-
 Denmark
-
 Dominican Republic
-
 Ecuador
-
 Egypt
-
 El Salvador
-
 Estonia
-
 Eswatini
-
 Ethiopia
-
 Finland
-
 France
-
 Georgia
-
 Germany
-
 Ghana
-
 Greece
-
 Haiti
-
 Hong Kong
-
 Hungary
-
 India
-
 Indonesia
-
 Iran, Islamic republic
-
 Iraq
-
 Ireland
-
 Israel
-
 Italy
-
 Jamaica
-
 Japan
-
 Jordan
-
 Kazakhstan
-
 Kenya
-
 Korea
-
 Kuwait
-
 Kyrgyzstan
-
 Laos
-
 Latvia
-
 Lebanon
-
 Lesotho
-
 Libya
-
 Lithuania
-
 Luxembourg
-
 Madagascar
-
 Malaysia
-
 Malta
-
 Mauritius
-
 Mexico
-
 Moldova
-
 Mongolia
-
 Montenegro
-
 Morocco
-
 Mozambique
-
 Myanmar
-
 Namibia
-
 Nepal
-
 Netherlands
-
 New Zealand
-
 Nigeria
-
 North Macedonia
-
 Norway
-
 Oman
-
 Pakistan
-
 Palestine
-
 Panama
-
 Papua New Guinea
-
 Paraguay
-
 Peru
-
 Philippines
-
 Poland
-
 Portugal
-
 Puerto Rico
-
 Qatar
-
 Reunion
-
 Romania
-
 Rwanda
-
 Saudi Arabia
-
 Serbia
-
 Singapore
-
 Slovakia
-
 Slovenia
-
 Somalia
-
 South Africa
-
 Spain
-
 Sri Lanka
-
 Sweden
-
 Switzerland
-
 Syria
-
 Taiwan
-
 Tajikistan
-
 Tanzania
-
 Thailand
-
 Trinidad and Tobago
-
 Tunisia
-
 Turkey
-
 UAE
-
 Uganda
-
 Ukraine
-
 United Kingdom
-
United States
-
 Uruguay
-
 Uzbekistan
-
 Venezuela
-
 Vietnam
-
 Yemen
-
 Zambia
-
 Zimbabwe
- Forex
- Crypto












