

Dollar General shares technical analysis: Buyer support drives upward price move

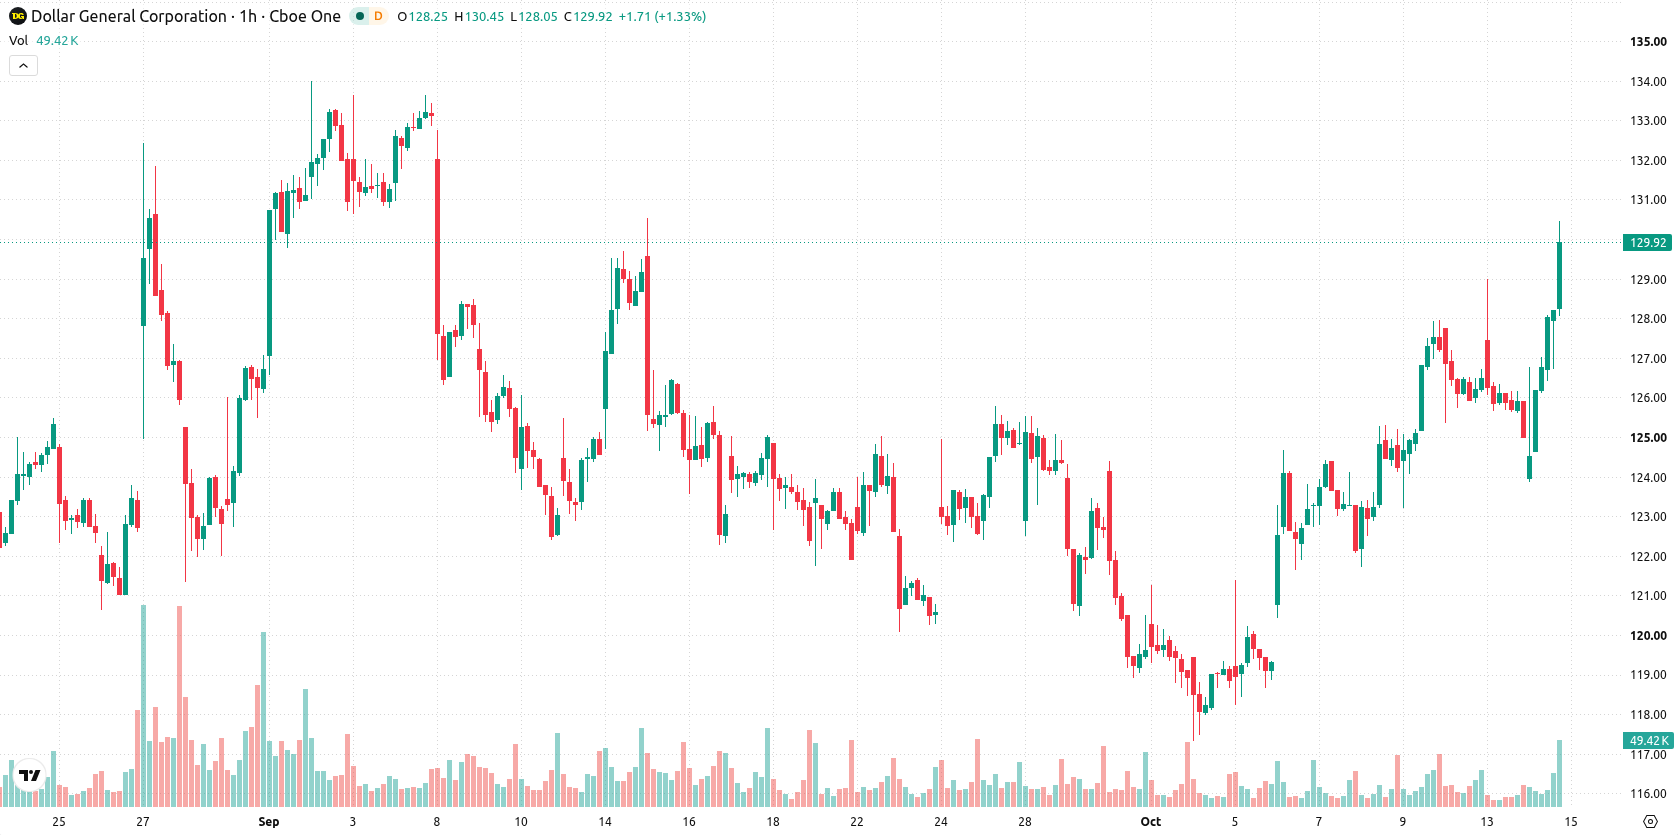
Dollar General (DG) stock is trading at $130.1, posting a daily gain of 4.09%. The price sits above its key moving averages, reflecting a strong short-term and long-term technical posture.
 136.05
136.05
136.05
Highlights
- DG/USD has displayed strong bullish momentum across short-, medium-, and long-term trends, trading above key moving averages.
- Price closed at $130.1, up 4.09%, and remains near the session high amid high volatility and buyer dominance.
- Expected trading range for the next 2 to 3 days is $126.87 to $133.33, with consolidation favored unless $133.33 resistance breaks.
Overbought momentum as multiple signals confirm buyer strength
On the technical front, DG trades above the MA-20 ($126.18) and MA-50 ($124.44) on the hourly chart, as well as the MA-200 ($126.42) on the daily chart. The Ichimoku Kijun level at $126.18 serves as immediate support. MACD registers a strong buy signal and ADX continues to indicate a buy, while RSI is elevated at 64.31. CCI, Stochastic RSI, and Bull/Bear Power all suggest overbought conditions and pronounced buyer dominance intraday. The Awesome Oscillator also reflects ongoing upward momentum, with the closing price positioned near the session high.
Further gains likely as resistance caps range
Over the next 2–3 trading days, DG is expected to consolidate in a range between $126.87 and $133.33, consistent with typical volatility. The probability of further upside remains very high, with a potential extension above $133.33 if resistance is breached. If support at $126.18 fails, a move toward the lower bound of the expected range may follow.
Earlier, analysts noted that Dollar General was demonstrating modest upward momentum as technical conditions improved. The current analysis not only confirms this positive shift but also highlights overbought signals, making the $133.33 resistance a key level to monitor for a potential breakout in the days ahead.




Latest Dollar General News





-
 Afghanistan
-
 Albania
-
 Algeria
-
 Angola
-
 Argentina
-
 Armenia
-
 Australia
-
 Austria
-
 Azerbaijan
-
 Bahamas
-
 Bahrain
-
 Bangladesh
-
 Belarus
-
 Belgium
-
 Bolivia
-
 Botswana
-
 Brazil
-
 Brunei
-
 Bulgaria
-
 Cambodia
-
 Cameroon
-
 Canada
-
 Chile
Chile
-
 China
China
-
 Colombia
-
 Congo
Congo
-
 Costa Rica
-
 Cote d'Ivoire
-
 Croatia
-
 Cuba
Cuba
-
 Cyprus
-
 Czechia
-
 DR Congo
-
 Denmark
-
 Dominican Republic
-
 Ecuador
-
 Egypt
Egypt
-
 El Salvador
-
 Estonia
-
 Eswatini
-
 Ethiopia
-
 Finland
-
 France
-
 Georgia
-
 Germany
-
 Ghana
Ghana
-
 Greece
-
 Haiti
Haiti
-
 Hong Kong
-
 Hungary
-
 India
India
-
 Indonesia
-
 Iran, Islamic republic
-
 Iraq
Iraq
-
 Ireland
-
 Israel
-
 Italy
Italy
-
 Jamaica
-
 Japan
Japan
-
 Jordan
-
 Kazakhstan
-
 Kenya
Kenya
-
 Korea
Korea
-
 Kuwait
-
 Kyrgyzstan
-
 Laos
Laos
-
 Latvia
-
 Lebanon
-
 Lesotho
-
 Libya
Libya
-
 Lithuania
-
 Luxembourg
-
 Madagascar
-
 Malaysia
-
 Malta
Malta
-
 Mauritius
-
 Mexico
-
 Moldova
-
 Mongolia
-
 Montenegro
-
 Morocco
-
 Mozambique
-
 Myanmar
-
 Namibia
-
 Nepal
Nepal
-
 Netherlands
-
 New Zealand
-
 Nigeria
-
 North Macedonia
-
 Norway
-
 Oman
Oman
-
 Pakistan
-
 Palestine
-
 Panama
-
 Papua New Guinea
-
 Paraguay
-
 Peru
Peru
-
 Philippines
-
 Poland
-
 Portugal
-
 Puerto Rico
-
 Qatar
Qatar
-
 Reunion
-
 Romania
-
 Rwanda
-
 Saudi Arabia
-
 Serbia
-
 Singapore
-
 Slovakia
-
 Slovenia
-
 Somalia
-
 South Africa
-
 Spain
Spain
-
 Sri Lanka
-
 Sweden
-
 Switzerland
-
 Syria
Syria
-
 Taiwan
-
 Tajikistan
-
 Tanzania
-
 Thailand
-
 Trinidad and Tobago
-
 Tunisia
-
 Turkey
-
 UAE
UAE
-
 Uganda
-
 Ukraine
-
 United Kingdom
-
United States
-
 Uruguay
-
 Uzbekistan
-
 Venezuela
-
 Vietnam
-
 Yemen
Yemen
-
 Zambia
-
 Zimbabwe
- Forex
- Crypto












