

Will BP stock break GBX635.81 resistance amid overbought conditions?

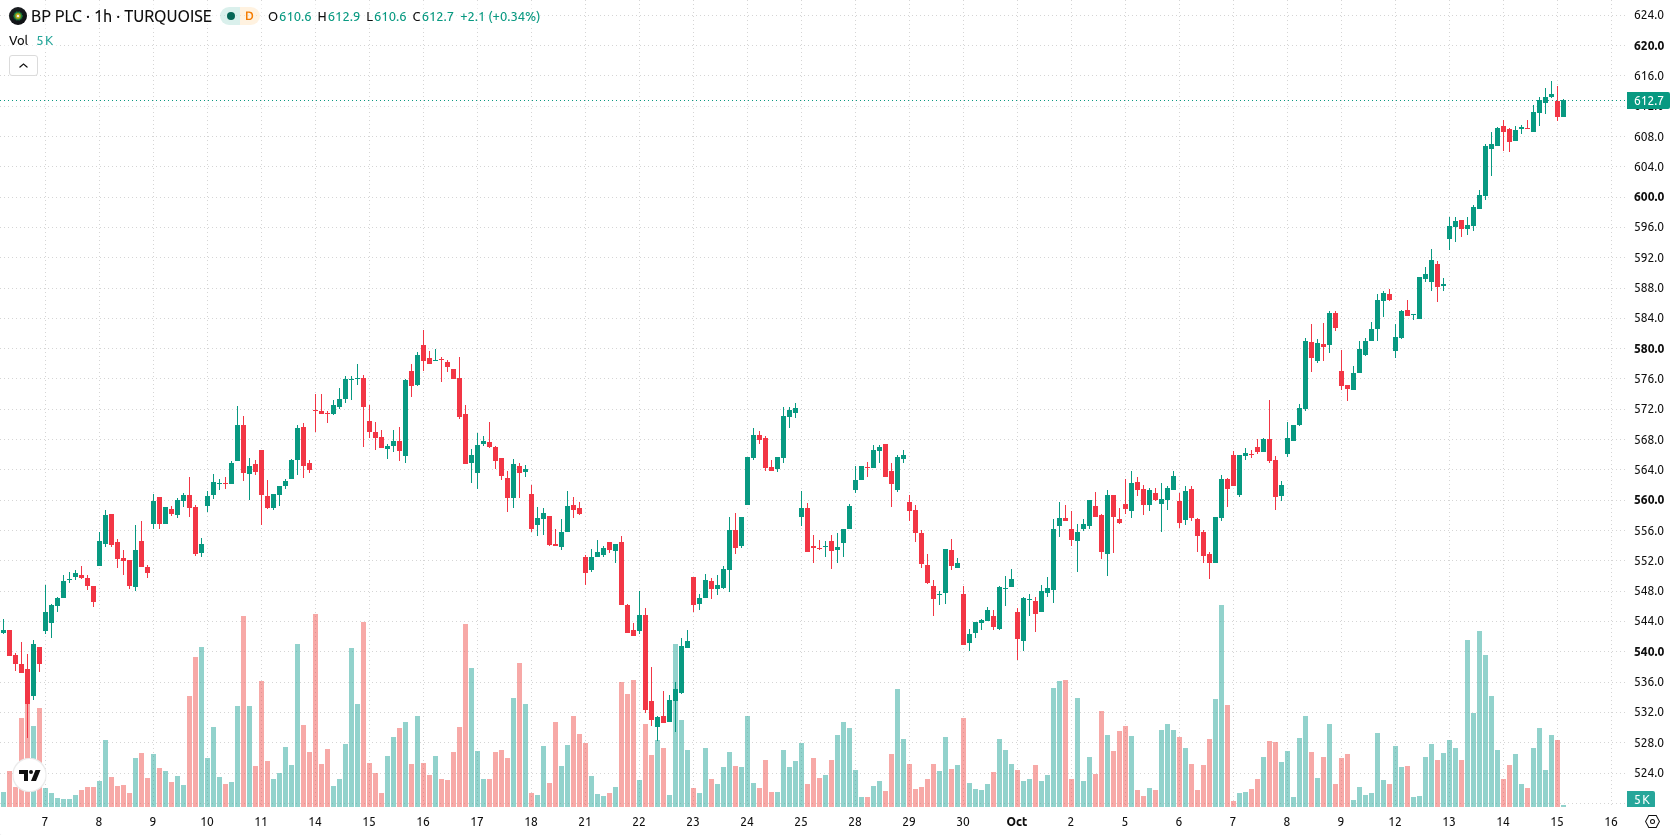
BP (BP) stock is trading at GBX613.4 after a modest gain in today's session. The price stands above its key moving averages, indicating a constructive stance in the current trend environment.
 616.70
616.70
616.70
Highlights
- Shares of BP are trading in a bullish structure above key moving averages on short and long-term charts.
- Momentum indicators confirm a strong short-term upward trend but signal the stock is entering overbought territory.
- BP stock is projected to fluctuate within a GBX590.99 to GBX635.81 range in the coming days, with a 74% probability of an upward move.
Bullish momentum persists despite overbought technical signals
On the hourly chart, BP is trading above the MA-20 at GBX603.84 and the MA-50 at GBX588.67, with the daily chart showing the price remains above the MA-200 at GBX521. Immediate support is identified at the Ichimoku Kijun level of GBX598.25. Momentum indicators display a bullish bias: MACD is rated Strong Buy and ADX signals a Buy, though caution is warranted as RSI stands at 79.54 with Stochastic RSI, CCI, and Bull/Bear Power all suggesting overbought conditions. The Awesome Oscillator is currently neutral, offering no additional signal for the prevailing trend.
Rangebound outlook as breakout hinges on resistance level
Over the next few trading days, BP is likely to consolidate within a typical volatility band between GBX590.99 and GBX635.81. The probability of an upward move is 74%, with a less likely 26% chance of a downside scenario. In the baseline scenario, the price remains rangebound; a bullish outcome would require a breakout above resistance, while a bearish case could unfold if BP drops below the Kijun level.
Earlier, analysts noted that BP was prioritizing balance sheet repair and capital discipline amid continued energy market volatility. The current technical setup, with overbought signals and a strong bullish bias, highlights GBX598.25 as a key level to watch for any potential shift in BP’s short-term trajectory.





Latest BP News





-
 Afghanistan
-
 Albania
-
 Algeria
-
 Angola
-
 Argentina
-
 Armenia
-
 Australia
-
 Austria
-
 Azerbaijan
-
 Bahamas
-
 Bahrain
-
 Bangladesh
-
 Belarus
-
 Belgium
-
 Bolivia
-
 Botswana
-
 Brazil
-
 Brunei
-
 Bulgaria
-
 Cambodia
-
 Cameroon
-
 Canada
-
 Chile
Chile
-
 China
China
-
 Colombia
-
 Congo
Congo
-
 Costa Rica
-
 Cote d'Ivoire
-
 Croatia
-
 Cuba
Cuba
-
 Cyprus
-
 Czechia
-
 DR Congo
-
 Denmark
-
 Dominican Republic
-
 Ecuador
-
 Egypt
Egypt
-
 El Salvador
-
 Estonia
-
 Eswatini
-
 Ethiopia
-
 Finland
-
 France
-
 Georgia
-
 Germany
-
 Ghana
Ghana
-
 Greece
-
 Haiti
Haiti
-
 Hong Kong
-
 Hungary
-
 India
India
-
 Indonesia
-
 Iran, Islamic republic
-
 Iraq
Iraq
-
 Ireland
-
 Israel
-
 Italy
Italy
-
 Jamaica
-
 Japan
Japan
-
 Jordan
-
 Kazakhstan
-
 Kenya
Kenya
-
 Korea
Korea
-
 Kuwait
-
 Kyrgyzstan
-
 Laos
Laos
-
 Latvia
-
 Lebanon
-
 Lesotho
-
 Libya
Libya
-
 Lithuania
-
 Luxembourg
-
 Madagascar
-
 Malaysia
-
 Malta
Malta
-
 Mauritius
-
 Mexico
-
 Moldova
-
 Mongolia
-
 Montenegro
-
 Morocco
-
 Mozambique
-
 Myanmar
-
 Namibia
-
 Nepal
Nepal
-
 Netherlands
-
 New Zealand
-
 Nigeria
-
 North Macedonia
-
 Norway
-
 Oman
Oman
-
 Pakistan
-
 Palestine
-
 Panama
-
 Papua New Guinea
-
 Paraguay
-
 Peru
Peru
-
 Philippines
-
 Poland
-
 Portugal
-
 Puerto Rico
-
 Qatar
Qatar
-
 Reunion
-
 Romania
-
 Rwanda
-
 Saudi Arabia
-
 Serbia
-
 Singapore
-
 Slovakia
-
 Slovenia
-
 Somalia
-
 South Africa
-
 Spain
Spain
-
 Sri Lanka
-
 Sweden
-
 Switzerland
-
 Syria
Syria
-
 Taiwan
-
 Tajikistan
-
 Tanzania
-
 Thailand
-
 Trinidad and Tobago
-
 Tunisia
-
 Turkey
-
 UAE
UAE
-
 Uganda
-
 Ukraine
-
 United Kingdom
-
United States
-
 Uruguay
-
 Uzbekistan
-
 Venezuela
-
 Vietnam
-
 Yemen
Yemen
-
 Zambia
-
 Zimbabwe
- Forex
- Crypto












