

Amazon stock faces overbought readings with support at the 200-day average in focus: weekly analysis

Shares of Amazon.com, Inc. (AMZN) are trading near $252 after slipping more than 4% this week as buyers struggle to regain control. Conflicting signals on the chart highlight indecision, with resistance and support clustering at key levels — setting up a tense standoff for the days ahead.
 255.36
Highlights
- Shares of Amazon fell 4.12% over the past 7 days to $251.85, trading below the 20-day and 50-day averages.
- The daily trend is flat with narrow-range movement and mixed signals from technical indicators, showing indecision near pivotal levels.
- For the next five trading days, the expected range is $247.31 to $256.38 with 42% probability of an increase and 58% probability of a decrease.
Earnings and AI acquisition plans drive sentiment ahead of Q3 2026 report
Amazon is drawing fresh attention as it prepares for its upcoming Q3 2026 earnings, with Yahoo Finance noting expectations for diluted EPS to grow 3.6% year-over-year. Multiple reports from MarketBeat and TradingKey indicate the company is in talks to acquire AI startup Decart for about $7 billion, potentially expanding AWS's artificial intelligence capabilities while raising questions around the return on $220 billion in planned capex spending. Fund analysis from Yahoo Finance and ongoing scrutiny of the AI investment plans underscore the stakes heading into the earnings report.
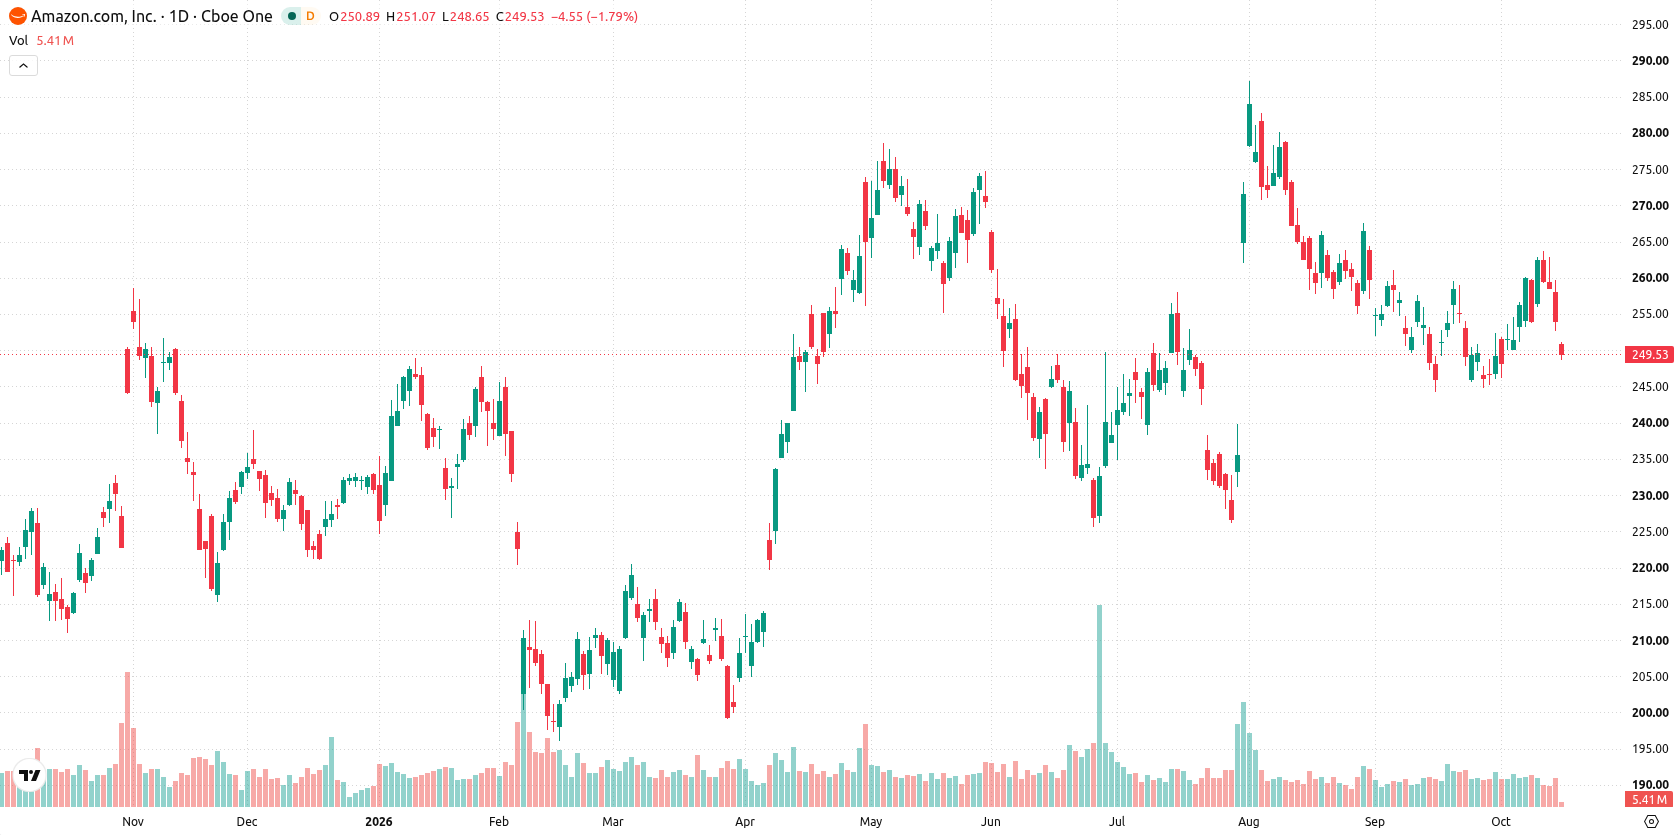
Mixed momentum signals persist as price hugs resistance and volatility stays contained
The daily chart presents a flat trend with a contained move within a narrow range, as reflected by the recent volatility of 4.02%. MACD remains in buy territory, yet the HMA signals a sell and Bull/Bear Power shows an overbought reading, highlighting mixed momentum signals. The stock is pinned to resistance at $252.66—the weekly low—while nearest support lies at $242.51, aligning with the 200-day average. With the RSI and CCI both sitting in neutral zones, the near-term setup suggests indecision around these pivotal levels.
Consolidation likely in the coming week unless support or resistance breaks
For the next five trading days, the expected range for Amazon is $247.31 to $256.38. There is a 42% probability of an increase and a 58% probability of a decrease. The base case is further consolidation between $252.66 resistance and $242.51 support. A push above $252.66 would open a path to the upper end of the expected range, while a drop below $242.51 would signal renewed downside risk.
Previously it was reported that Amazon expanded its AI hardware portfolio with the launch of two new Bee listening devices and deepened its long-term AI strategy. The current technical picture introduces heightened uncertainty, making the $252.66 resistance and $242.51 support levels critical triggers for a directional move as earnings and major AI acquisition talks come into focus.






Latest Amazon News





-
 Afghanistan
-
 Albania
-
 Algeria
-
 Angola
-
 Argentina
-
 Armenia
-
 Australia
-
 Austria
-
 Azerbaijan
-
 Bahamas
-
 Bahrain
-
 Bangladesh
-
 Belarus
-
 Belgium
-
 Bolivia
-
 Botswana
-
 Brazil
-
 Brunei
-
 Bulgaria
-
 Cambodia
-
 Cameroon
-
 Canada
-
 Chile
-
 China
-
 Colombia
-
 Congo
-
 Costa Rica
-
 Cote d'Ivoire
-
 Croatia
-
 Cuba
-
 Cyprus
-
 Czechia
-
 DR Congo
-
 Denmark
-
 Dominican Republic
-
 Ecuador
-
 Egypt
-
 El Salvador
-
 Estonia
-
 Eswatini
-
 Ethiopia
-
 Finland
-
 France
-
 Georgia
-
 Germany
-
 Ghana
-
 Greece
-
 Haiti
-
 Hong Kong
-
 Hungary
-
 India
-
 Indonesia
-
 Iran, Islamic republic
-
 Iraq
-
 Ireland
-
 Israel
-
 Italy
-
 Jamaica
-
 Japan
-
 Jordan
-
 Kazakhstan
-
 Kenya
-
 Korea
-
 Kuwait
-
 Kyrgyzstan
-
 Laos
-
 Latvia
-
 Lebanon
-
 Lesotho
-
 Libya
-
 Lithuania
-
 Luxembourg
-
 Madagascar
-
 Malaysia
-
 Malta
-
 Mauritius
-
 Mexico
-
 Moldova
-
 Mongolia
-
 Montenegro
-
 Morocco
-
 Mozambique
-
 Myanmar
-
 Namibia
-
 Nepal
-
 Netherlands
-
 New Zealand
-
 Nigeria
-
 North Macedonia
-
 Norway
-
 Oman
-
 Pakistan
-
 Palestine
-
 Panama
-
 Papua New Guinea
-
 Paraguay
-
 Peru
-
 Philippines
-
 Poland
-
 Portugal
-
 Puerto Rico
-
 Qatar
-
 Reunion
-
 Romania
-
 Rwanda
-
 Saudi Arabia
-
 Serbia
-
 Singapore
-
 Slovakia
-
 Slovenia
-
 Somalia
-
 South Africa
-
 Spain
-
 Sri Lanka
-
 Sweden
-
 Switzerland
-
 Syria
-
 Taiwan
-
 Tajikistan
-
 Tanzania
-
 Thailand
-
 Trinidad and Tobago
-
 Tunisia
-
 Turkey
-
 UAE
-
 Uganda
-
 Ukraine
-
 United Kingdom
-
United States
-
 Uruguay
-
 Uzbekistan
-
 Venezuela
-
 Vietnam
-
 Yemen
-
 Zambia
-
 Zimbabwe
- Forex
- Crypto












