

Berkshire Hathaway stock weekly forecast: MACD remains bullish as overbought momentum challenges next move

Shares of Berkshire Hathaway Inc. (BRK.B) are trading near $530 as the rally extended over the past week, gaining nearly 3%. The move comes amid strong investor momentum, but with technical signals flashing overbought, traders are on watch for whether this rally can sustain into next week.
 556.56
Highlights
- Shares of Berkshire Hathaway rose 2.89% in the past week to $530.15, ending at the top of their recent range.
- The stock trades above both its 20-day and 50-day moving averages, with technical momentum now in the overbought zone.
- For the next five trading days, there is a very high probability of a rise within a $524 to $536.29 range, with key support at $527.04.
Fresh tech investment and insurance earnings shape sentiment for the week
Berkshire made headlines with another $330 million investment in Italian technology firm Bending Spoons, bringing its total commitment since the company's July IPO to nearly $930 million and increasing its ownership stake to 4%, according to Yahoo Finance. Meanwhile, Berkshire's insurance arm posted a 14% year-over-year decline in underwriting earnings in the second quarter of 2026 as Geico faced higher auto insurance claim costs, as reported by USA Herald. Investors will be focused on the impact of these moves and results in the coming week.
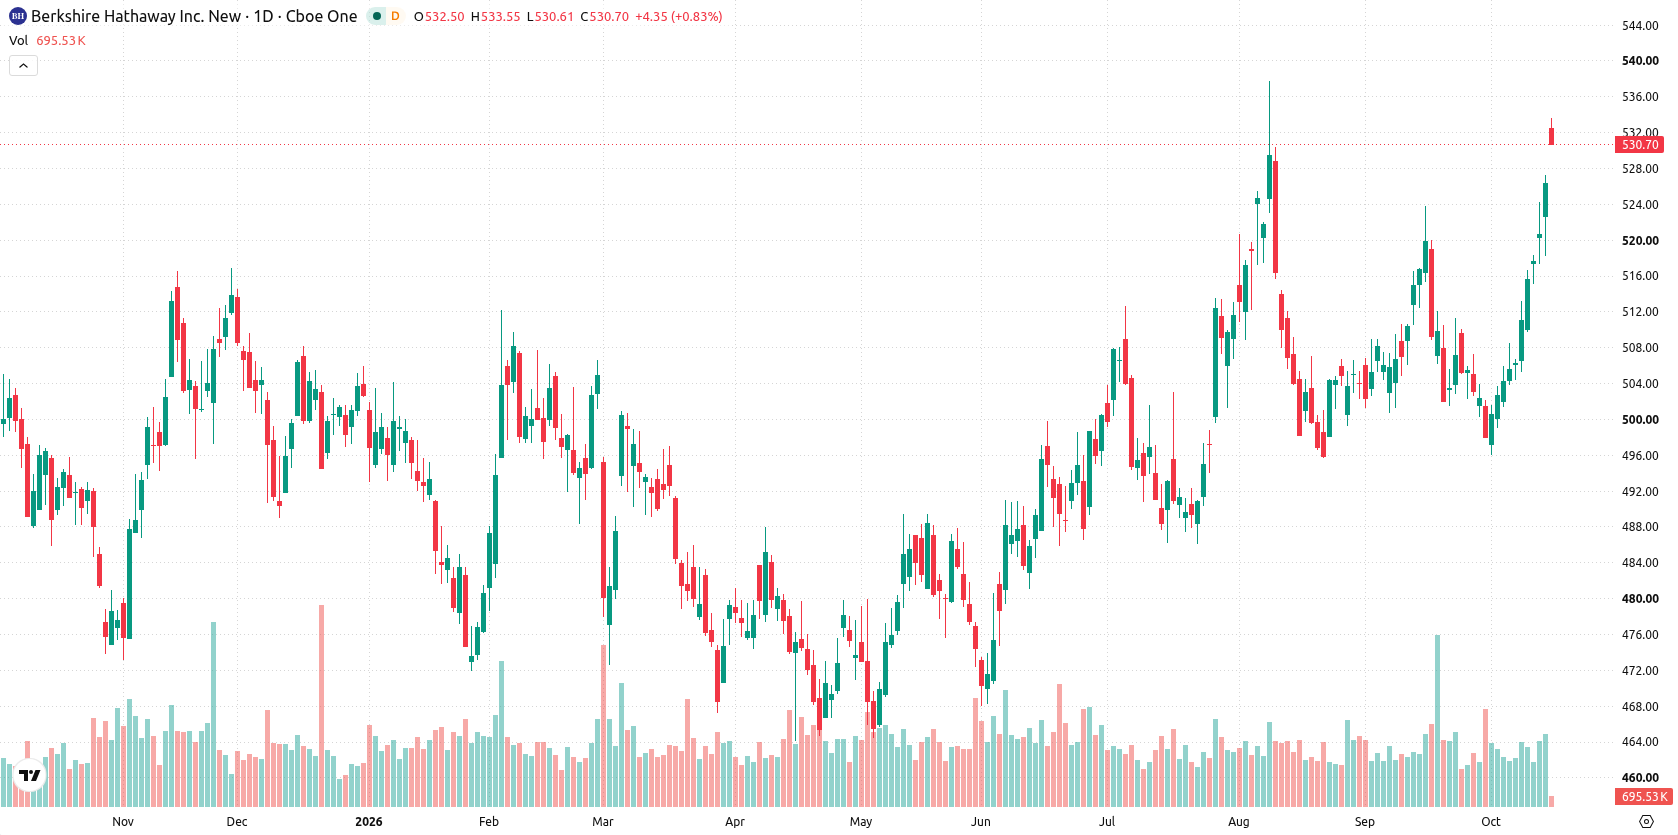
Overbought momentum intensifies as price exceeds short-term averages
On the daily chart, Berkshire Hathaway has staged a sustained push higher, with price now 4.38% above its 20-day moving average and momentum signals in the overbought zone. Both RSI and CCI have moved into overbought territory, with the RSI at 71.91, suggesting caution as the recent gains may be becoming stretched. The MACD remains bullish while daily volatility over the past week measured 2.68%, and the move appears to be a contained move within a narrow range. Nearest support sits at $527.04, just below current levels, while the Ichimoku Kijun at $511.45 also offers practical backing.
Bullish bias prevails as support tests and resistance break risk guide outlook
Over the next five trading days, the expected range is $524 to $536.29. There is a very high probability (more than 80%) of a further increase and a very low probability (less than 20%) of a decrease. The base case is continued consolidation above $527.04 support, with the bullish scenario opening up if price exceeds $536.29. If the stock falls below $527.04, a move toward the Ichimoku Kijun at $511.45 becomes more likely.
Previously it was reported that Berkshire Hathaway's recent gains were supported by strategic investments and a favorable outlook across its core businesses. The current technical setup highlights a consolidation phase with overbought signals, making the $527.04 support and $536.29 resistance key levels to watch as traders assess the rally’s durability in the near term.






Latest Berkshire Hathaway News





-
 Afghanistan
-
 Albania
-
 Algeria
-
 Angola
-
 Argentina
-
 Armenia
-
 Australia
-
 Austria
-
 Azerbaijan
-
 Bahamas
-
 Bahrain
-
 Bangladesh
-
 Belarus
-
 Belgium
-
 Bolivia
-
 Botswana
-
 Brazil
-
 Brunei
-
 Bulgaria
-
 Cambodia
-
 Cameroon
-
 Canada
-
 Chile
-
 China
-
 Colombia
-
 Congo
-
 Costa Rica
-
 Cote d'Ivoire
-
 Croatia
-
 Cuba
-
 Cyprus
-
 Czechia
-
 DR Congo
-
 Denmark
-
 Dominican Republic
-
 Ecuador
-
 Egypt
-
 El Salvador
-
 Estonia
-
 Eswatini
-
 Ethiopia
-
 Finland
-
 France
-
 Georgia
-
 Germany
-
 Ghana
-
 Greece
-
 Haiti
-
 Hong Kong
-
 Hungary
-
 India
-
 Indonesia
-
 Iran, Islamic republic
-
 Iraq
-
 Ireland
-
 Israel
-
 Italy
-
 Jamaica
-
 Japan
-
 Jordan
-
 Kazakhstan
-
 Kenya
-
 Korea
-
 Kuwait
-
 Kyrgyzstan
-
 Laos
-
 Latvia
-
 Lebanon
-
 Lesotho
-
 Libya
-
 Lithuania
-
 Luxembourg
-
 Madagascar
-
 Malaysia
-
 Malta
-
 Mauritius
-
 Mexico
-
 Moldova
-
 Mongolia
-
 Montenegro
-
 Morocco
-
 Mozambique
-
 Myanmar
-
 Namibia
-
 Nepal
-
 Netherlands
-
 New Zealand
-
 Nigeria
-
 North Macedonia
-
 Norway
-
 Oman
-
 Pakistan
-
 Palestine
-
 Panama
-
 Papua New Guinea
-
 Paraguay
-
 Peru
-
 Philippines
-
 Poland
-
 Portugal
-
 Puerto Rico
-
 Qatar
-
 Reunion
-
 Romania
-
 Rwanda
-
 Saudi Arabia
-
 Serbia
-
 Singapore
-
 Slovakia
-
 Slovenia
-
 Somalia
-
 South Africa
-
 Spain
-
 Sri Lanka
-
 Sweden
-
 Switzerland
-
 Syria
-
 Taiwan
-
 Tajikistan
-
 Tanzania
-
 Thailand
-
 Trinidad and Tobago
-
 Tunisia
-
 Turkey
-
 UAE
-
 Uganda
-
 Ukraine
-
 United Kingdom
-
United States
-
 Uruguay
-
 Uzbekistan
-
 Venezuela
-
 Vietnam
-
 Yemen
-
 Zambia
-
 Zimbabwe
- Forex
- Crypto












