

Positive earnings lift BlackRock stock as buyer support drives upward price move

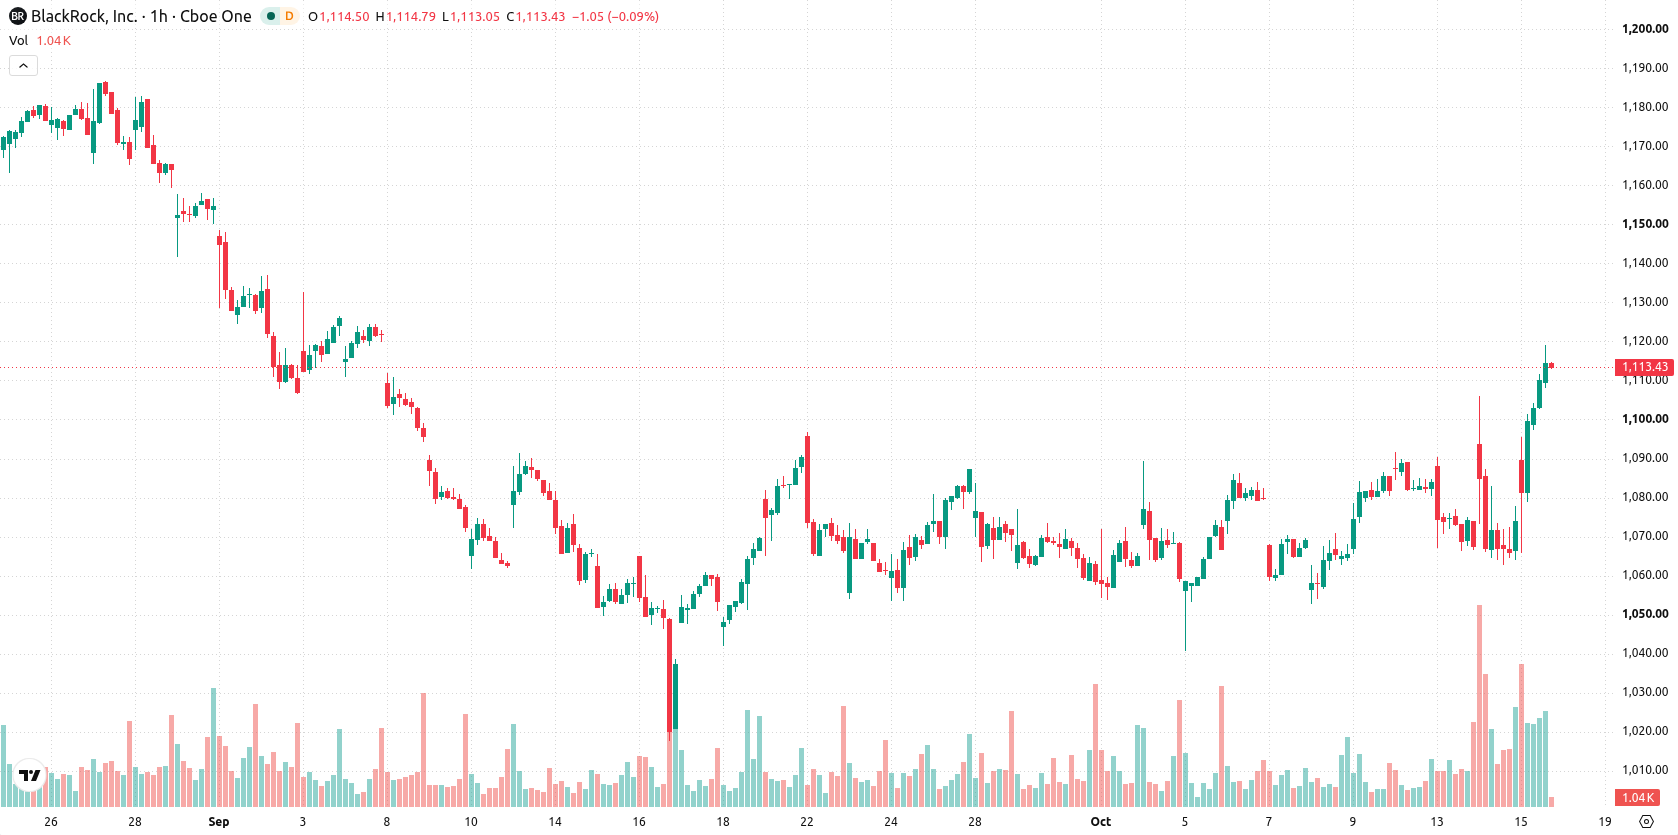
BlackRock (BLK) stock is trading at $1,114, registering a daily gain of 3.75%. The price sits well above its key moving averages, highlighting persistent upward momentum relative to recent trading ranges.
 1149.15
Highlights
- BlackRock reported third-quarter 2026 revenue of $7.75 billion and net income of $1.66 billion, showing resilient profitability.
- The company recorded $205 billion in net inflows, including record subscriptions to its iShares ETFs, indicating strong demand.
- Shares of BlackRock rose 3.75% to $1,114, with technicals pointing to short-term consolidation between $1,095 and $1,133 as buyer strength conflicts with mixed momentum signals.
Record ETF inflows bolster buying as earnings highlight scale
BlackRock reported its third-quarter 2026 results on Wednesday, with revenue rising to $7.75 billion and net income reaching $1.66 billion, underscoring resilient profitability and operational scale. The company recorded substantial new client inflows totaling $205 billion for the quarter and achieved record subscriptions in its iShares ETFs, according to Yahoo Finance. These robust inflows highlight increased investor demand for BlackRock's offerings, underpinning current buying momentum.
Mixed technical signals amid support at Kijun and overbought readings
Technically, BLK is trading above the MA-20 and MA-50 at $1,074 on the H1 timeframe, and also above the MA-200 at $1,060 on the daily chart. The Ichimoku Kijun at $1,084 presents the most immediate support zone, with the next notable price range between $1,095 and $1,133. On the indicator front, RSI reads 48.01 (Sell bias), with MACD also signaling Sell and ADX at Buy, indicating underlying trend strength. Meanwhile, Stochastic RSI and CCI remain Neutral, with mixed signals across oscillators, and Bull/Bear Power marking an Overbought condition, while Awesome Oscillator is Neutral.
Upside breakout risk elevated as rangebound trade persists
In the short term, BLK is expected to consolidate between $1,095 and $1,133, forming a volatility band around the current price. The primary scenario anticipates continued rangebound trading within this corridor. With a 74% probability skewed to the upside, a bullish breakout above $1,133 could trigger fresh highs, while a move below immediate support at $1,084 may prompt a corrective pullback.
Earlier, analysts noted that BlackRock's technical outlook remained constructive despite a prior pullback, with longer-term momentum seen as supportive. The current data not only reinforces this constructive view but also points to a prevailing scenario of continued rangebound trading, with $1,133 as a key resistance level to monitor for a potential breakout.







-
 Afghanistan
-
 Albania
-
 Algeria
-
 Angola
-
 Argentina
-
 Armenia
-
 Australia
-
 Austria
-
 Azerbaijan
-
 Bahamas
-
 Bahrain
-
 Bangladesh
-
 Belarus
-
 Belgium
-
 Bolivia
-
 Botswana
-
 Brazil
-
 Brunei
-
 Bulgaria
-
 Cambodia
-
 Cameroon
-
 Canada
-
 Chile
-
 China
-
 Colombia
-
 Congo
-
 Costa Rica
-
 Cote d'Ivoire
-
 Croatia
-
 Cuba
-
 Cyprus
-
 Czechia
-
 DR Congo
-
 Denmark
-
 Dominican Republic
-
 Ecuador
-
 Egypt
-
 El Salvador
-
 Estonia
-
 Eswatini
-
 Ethiopia
-
 Finland
-
 France
-
 Georgia
-
 Germany
-
 Ghana
-
 Greece
-
 Haiti
-
 Hong Kong
-
 Hungary
-
 India
-
 Indonesia
-
 Iran, Islamic republic
-
 Iraq
-
 Ireland
-
 Israel
-
 Italy
-
 Jamaica
-
 Japan
-
 Jordan
-
 Kazakhstan
-
 Kenya
-
 Korea
-
 Kuwait
-
 Kyrgyzstan
-
 Laos
-
 Latvia
-
 Lebanon
-
 Lesotho
-
 Libya
-
 Lithuania
-
 Luxembourg
-
 Madagascar
-
 Malaysia
-
 Malta
-
 Mauritius
-
 Mexico
-
 Moldova
-
 Mongolia
-
 Montenegro
-
 Morocco
-
 Mozambique
-
 Myanmar
-
 Namibia
-
 Nepal
-
 Netherlands
-
 New Zealand
-
 Nigeria
-
 North Macedonia
-
 Norway
-
 Oman
-
 Pakistan
-
 Palestine
-
 Panama
-
 Papua New Guinea
-
 Paraguay
-
 Peru
-
 Philippines
-
 Poland
-
 Portugal
-
 Puerto Rico
-
 Qatar
-
 Reunion
-
 Romania
-
 Rwanda
-
 Saudi Arabia
-
 Serbia
-
 Singapore
-
 Slovakia
-
 Slovenia
-
 Somalia
-
 South Africa
-
 Spain
-
 Sri Lanka
-
 Sweden
-
 Switzerland
-
 Syria
-
 Taiwan
-
 Tajikistan
-
 Tanzania
-
 Thailand
-
 Trinidad and Tobago
-
 Tunisia
-
 Turkey
-
 UAE
-
 Uganda
-
 Ukraine
-
 United Kingdom
-
United States
-
 Uruguay
-
 Uzbekistan
-
 Venezuela
-
 Vietnam
-
 Yemen
-
 Zambia
-
 Zimbabwe
- Forex
- Crypto












