

GSK shares technical analysis: Overbought conditions highlight reversal setup

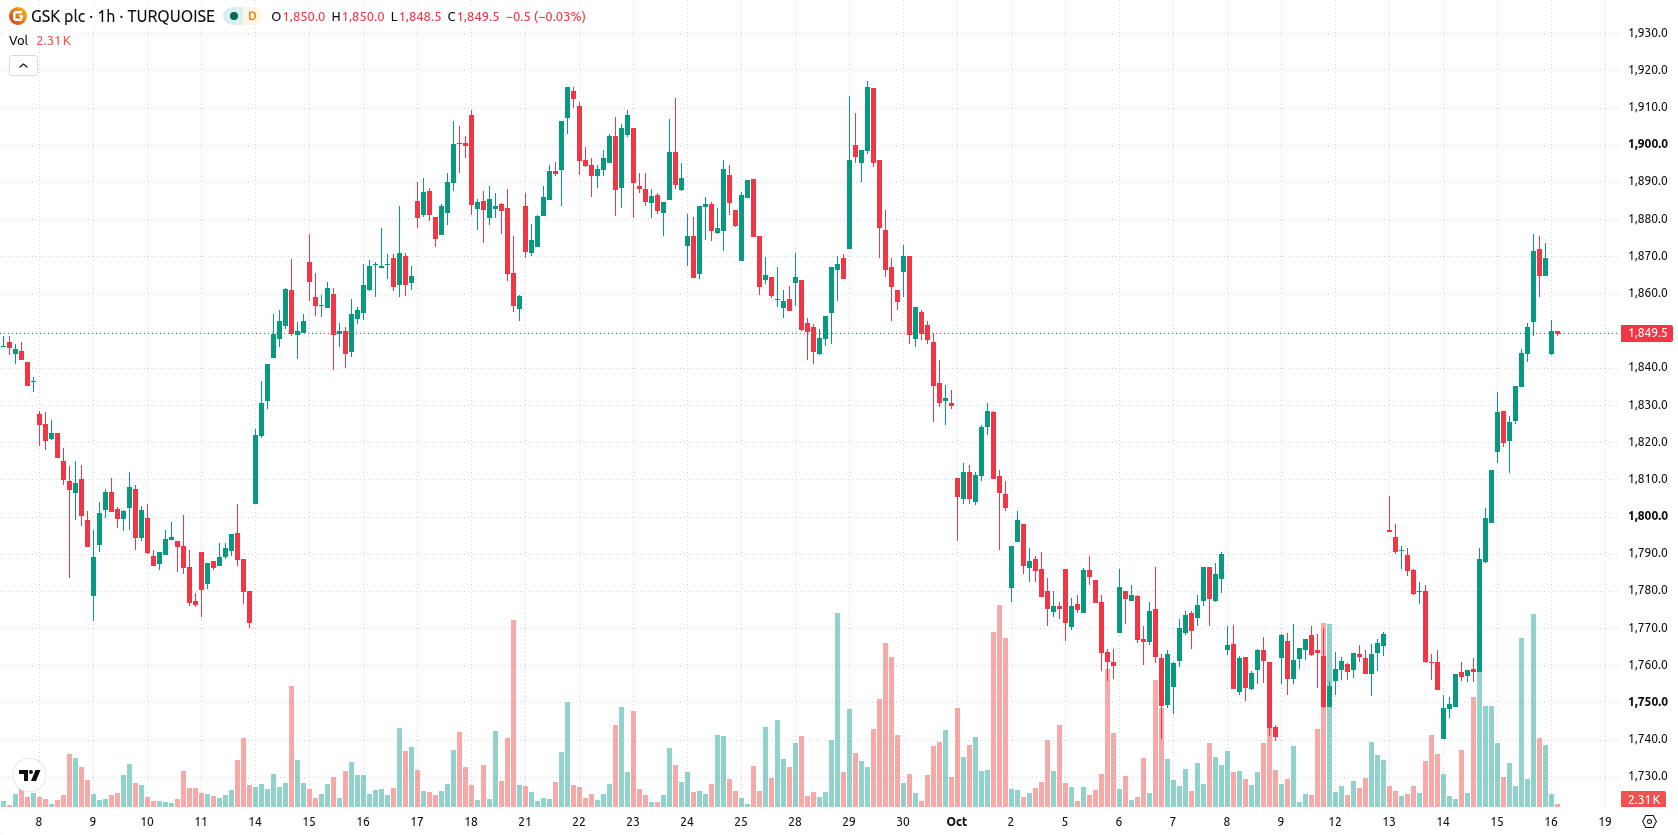
GSK (GSK) stock is trading at GBX1,845, marking a daily decline of 1.26%. The price currently sits above its key moving averages, indicating short- and medium-term momentum but below longer-term averages.
 1870.35
1877.50
1870.35
1877.50
Highlights
- GSK plans to eliminate up to 1,217 jobs in Belgium to reduce costs and improve operational efficiency.
- Management expects the restructuring to support future profitability, but short-term uncertainty may affect local sentiment.
- Shares of GSK closed at GBX1,845 after falling 1.26%, with mixed technical signals and an expected trading range of GBX1,783 to GBX1,910 for the coming sessions.
Job cuts drive cost focus but fuel local uncertainty and negative tone
GSK is planning to eliminate up to 1,217 jobs in Belgium as part of a corporate restructuring effort, according to Latestly. This move signals management's intent to address cost structures and improve operational efficiency, which could support future profitability. However, workforce reductions of this scale often introduce short-term uncertainty and may weigh on local sentiment, aligning with the current price direction.
Buy signals dominate amid overbought risks and mixed momentum cues
On the hourly chart, GSK is trading above the MA-20 at GBX1,806 and the MA-50 at GBX1,782, while remaining below the long-term MA-200 at GBX1,951. The Ichimoku Kijun sits at GBX1,808 and provides immediate support. Momentum indicators are mixed: MACD, ADX, and CCI each register Buy signals, while RSI is elevated at 63.9, showing a buy-side tilt but nearing overbought conditions. Stochastic RSI is neutral, CCI signals Buy, and Bull/Bear Power suggests overbought intraday conditions. The Awesome Oscillator remains neutral, offering little confirmation for further upside.
Consolidation likely as breakout hinges on resistance and support levels
In the near term, the expected price range for GSK is GBX1,783 to GBX1,910. Price is anticipated to consolidate within this corridor, with a 70% likelihood of sideways or upward movement and 30% probability of a downward move. A close above resistance may prompt a breakout toward the upper end of the range, while a slip below immediate support could trigger a test of the lower boundary.
Earlier, analysts noted that while insider share purchases provided support to GSK, persistent technical resistance maintained a cautious outlook. The current technical alignment underscores a watchful stance, with traders advised to monitor for a potential breakout or breakdown from the GBX1,783 to GBX1,910 trading corridor as new restructuring measures unfold.








-
 Afghanistan
-
 Albania
-
 Algeria
-
 Angola
-
 Argentina
-
 Armenia
-
 Australia
-
 Austria
-
 Azerbaijan
-
 Bahamas
-
 Bahrain
-
 Bangladesh
-
 Belarus
-
 Belgium
-
 Bolivia
-
 Botswana
-
 Brazil
-
 Brunei
-
 Bulgaria
-
 Cambodia
-
 Cameroon
-
 Canada
-
 Chile
Chile
-
 China
China
-
 Colombia
-
 Congo
Congo
-
 Costa Rica
-
 Cote d'Ivoire
-
 Croatia
-
 Cuba
Cuba
-
 Cyprus
-
 Czechia
-
 DR Congo
-
 Denmark
-
 Dominican Republic
-
 Ecuador
-
 Egypt
Egypt
-
 El Salvador
-
 Estonia
-
 Eswatini
-
 Ethiopia
-
 Finland
-
 France
-
 Georgia
-
 Germany
-
 Ghana
Ghana
-
 Greece
-
 Haiti
Haiti
-
 Hong Kong
-
 Hungary
-
 India
India
-
 Indonesia
-
 Iran, Islamic republic
-
 Iraq
Iraq
-
 Ireland
-
 Israel
-
 Italy
Italy
-
 Jamaica
-
 Japan
Japan
-
 Jordan
-
 Kazakhstan
-
 Kenya
Kenya
-
 Korea
Korea
-
 Kuwait
-
 Kyrgyzstan
-
 Laos
Laos
-
 Latvia
-
 Lebanon
-
 Lesotho
-
 Libya
Libya
-
 Lithuania
-
 Luxembourg
-
 Madagascar
-
 Malaysia
-
 Malta
Malta
-
 Mauritius
-
 Mexico
-
 Moldova
-
 Mongolia
-
 Montenegro
-
 Morocco
-
 Mozambique
-
 Myanmar
-
 Namibia
-
 Nepal
Nepal
-
 Netherlands
-
 New Zealand
-
 Nigeria
-
 North Macedonia
-
 Norway
-
 Oman
Oman
-
 Pakistan
-
 Palestine
-
 Panama
-
 Papua New Guinea
-
 Paraguay
-
 Peru
Peru
-
 Philippines
-
 Poland
-
 Portugal
-
 Puerto Rico
-
 Qatar
Qatar
-
 Reunion
-
 Romania
-
 Rwanda
-
 Saudi Arabia
-
 Serbia
-
 Singapore
-
 Slovakia
-
 Slovenia
-
 Somalia
-
 South Africa
-
 Spain
Spain
-
 Sri Lanka
-
 Sweden
-
 Switzerland
-
 Syria
Syria
-
 Taiwan
-
 Tajikistan
-
 Tanzania
-
 Thailand
-
 Trinidad and Tobago
-
 Tunisia
-
 Turkey
-
 UAE
UAE
-
 Uganda
-
 Ukraine
-
 United Kingdom
-
United States
-
 Uruguay
-
 Uzbekistan
-
 Venezuela
-
 Vietnam
-
 Yemen
Yemen
-
 Zambia
-
 Zimbabwe
- Forex
- Crypto












