

MARA drops as seller pressure drives downward price move

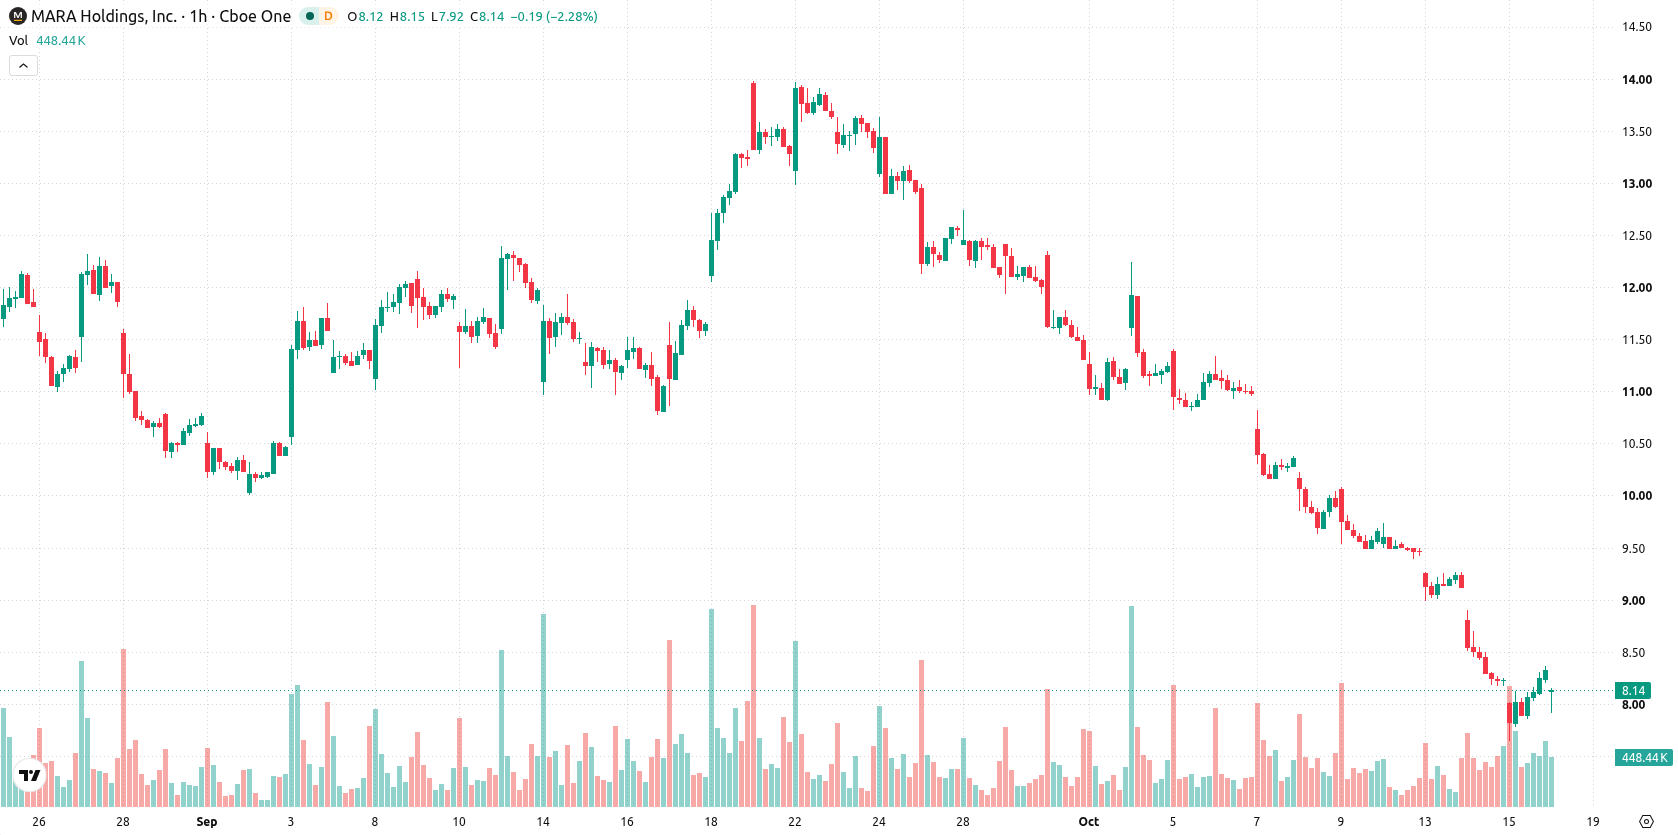
Marathon Digital Holdings, Inc. (MARA, formerly Marathon Patent Group, Inc.) stock is trading at $8.09, marking a daily decline of 2.88%. The price remains below its key moving averages, indicating a continuation of downward pressure in the short term.
 8.23
9.73
8.23
9.73
Highlights
- MARA/USD trades below key moving averages on both hourly and daily timeframes, indicating continuing strong selling pressure.
- Momentum indicators such as MACD and ADX show strong sell signals, with RSI reading in oversold territory and high volatility present.
- The expected 2 to 3 day trading range is $7.16 to $9.02, with a 65% probability of a downward move and 35% for an upward move.
Bearish momentum and resistance as oscillators diverge on volatility
On the technical side, MARA is trading below the MA-20 ($8.5) and MA-50 ($9.3) on the hourly chart, as well as the MA-200 ($10.96) on the daily chart. The Ichimoku Kijun level at $8.61 is acting as immediate resistance. MACD shows strong sell momentum, and ADX confirms sellers’ control, while RSI stands at 38.56. There is a divergence among oscillators, with Stoch RSI reading as overbought, whereas both CCI and Awesome Oscillator remain neutral. Notably, Bull/Bear Power signals strong buyer dominance intraday, which is somewhat at odds with the negative daily momentum, and overall volatility remains high.
Rangebound outcome favored as downside risk outweighs breakout odds
Looking ahead over the next 2–3 days, price action is expected to remain within a projected range of $7.16 to $9.02. The probability of a move to the upside is estimated at 35%, while a downward move is seen as more likely at 65%. The base case expects MARA to remain in a sideways corridor, with any sustained break above immediate resistance potentially triggering a bullish scenario, while a fall below key support could lead to a retest of the range low.
Earlier, analysts noted that Marathon Digital remained under persistent technical pressure, with downside risks prevailing. The current article confirms this bearish outlook as the continuation of negative momentum and high intraday volatility underscores the importance of monitoring $7.16 as a critical short-term support level.









-
 Afghanistan
-
 Albania
-
 Algeria
-
 Angola
-
 Argentina
-
 Armenia
-
 Australia
-
 Austria
-
 Azerbaijan
-
 Bahamas
-
 Bahrain
-
 Bangladesh
-
 Belarus
-
 Belgium
-
 Bolivia
-
 Botswana
-
 Brazil
-
 Brunei
-
 Bulgaria
-
 Cambodia
-
 Cameroon
-
 Canada
-
 Chile
Chile
-
 China
China
-
 Colombia
-
 Congo
Congo
-
 Costa Rica
-
 Cote d'Ivoire
-
 Croatia
-
 Cuba
Cuba
-
 Cyprus
-
 Czechia
-
 DR Congo
-
 Denmark
-
 Dominican Republic
-
 Ecuador
-
 Egypt
Egypt
-
 El Salvador
-
 Estonia
-
 Eswatini
-
 Ethiopia
-
 Finland
-
 France
-
 Georgia
-
 Germany
-
 Ghana
Ghana
-
 Greece
-
 Haiti
Haiti
-
 Hong Kong
-
 Hungary
-
 India
India
-
 Indonesia
-
 Iran, Islamic republic
-
 Iraq
Iraq
-
 Ireland
-
 Israel
-
 Italy
Italy
-
 Jamaica
-
 Japan
Japan
-
 Jordan
-
 Kazakhstan
-
 Kenya
Kenya
-
 Korea
Korea
-
 Kuwait
-
 Kyrgyzstan
-
 Laos
Laos
-
 Latvia
-
 Lebanon
-
 Lesotho
-
 Libya
Libya
-
 Lithuania
-
 Luxembourg
-
 Madagascar
-
 Malaysia
-
 Malta
Malta
-
 Mauritius
-
 Mexico
-
 Moldova
-
 Mongolia
-
 Montenegro
-
 Morocco
-
 Mozambique
-
 Myanmar
-
 Namibia
-
 Nepal
Nepal
-
 Netherlands
-
 New Zealand
-
 Nigeria
-
 North Macedonia
-
 Norway
-
 Oman
Oman
-
 Pakistan
-
 Palestine
-
 Panama
-
 Papua New Guinea
-
 Paraguay
-
 Peru
Peru
-
 Philippines
-
 Poland
-
 Portugal
-
 Puerto Rico
-
 Qatar
Qatar
-
 Reunion
-
 Romania
-
 Rwanda
-
 Saudi Arabia
-
 Serbia
-
 Singapore
-
 Slovakia
-
 Slovenia
-
 Somalia
-
 South Africa
-
 Spain
Spain
-
 Sri Lanka
-
 Sweden
-
 Switzerland
-
 Syria
Syria
-
 Taiwan
-
 Tajikistan
-
 Tanzania
-
 Thailand
-
 Trinidad and Tobago
-
 Tunisia
-
 Turkey
-
 UAE
UAE
-
 Uganda
-
 Ukraine
-
 United Kingdom
-
United States
-
 Uruguay
-
 Uzbekistan
-
 Venezuela
-
 Vietnam
-
 Yemen
Yemen
-
 Zambia
-
 Zimbabwe
- Forex
- Crypto












