

Riot Platforms shares technical analysis: Seller pressure keeps bears in control below $13.56 support

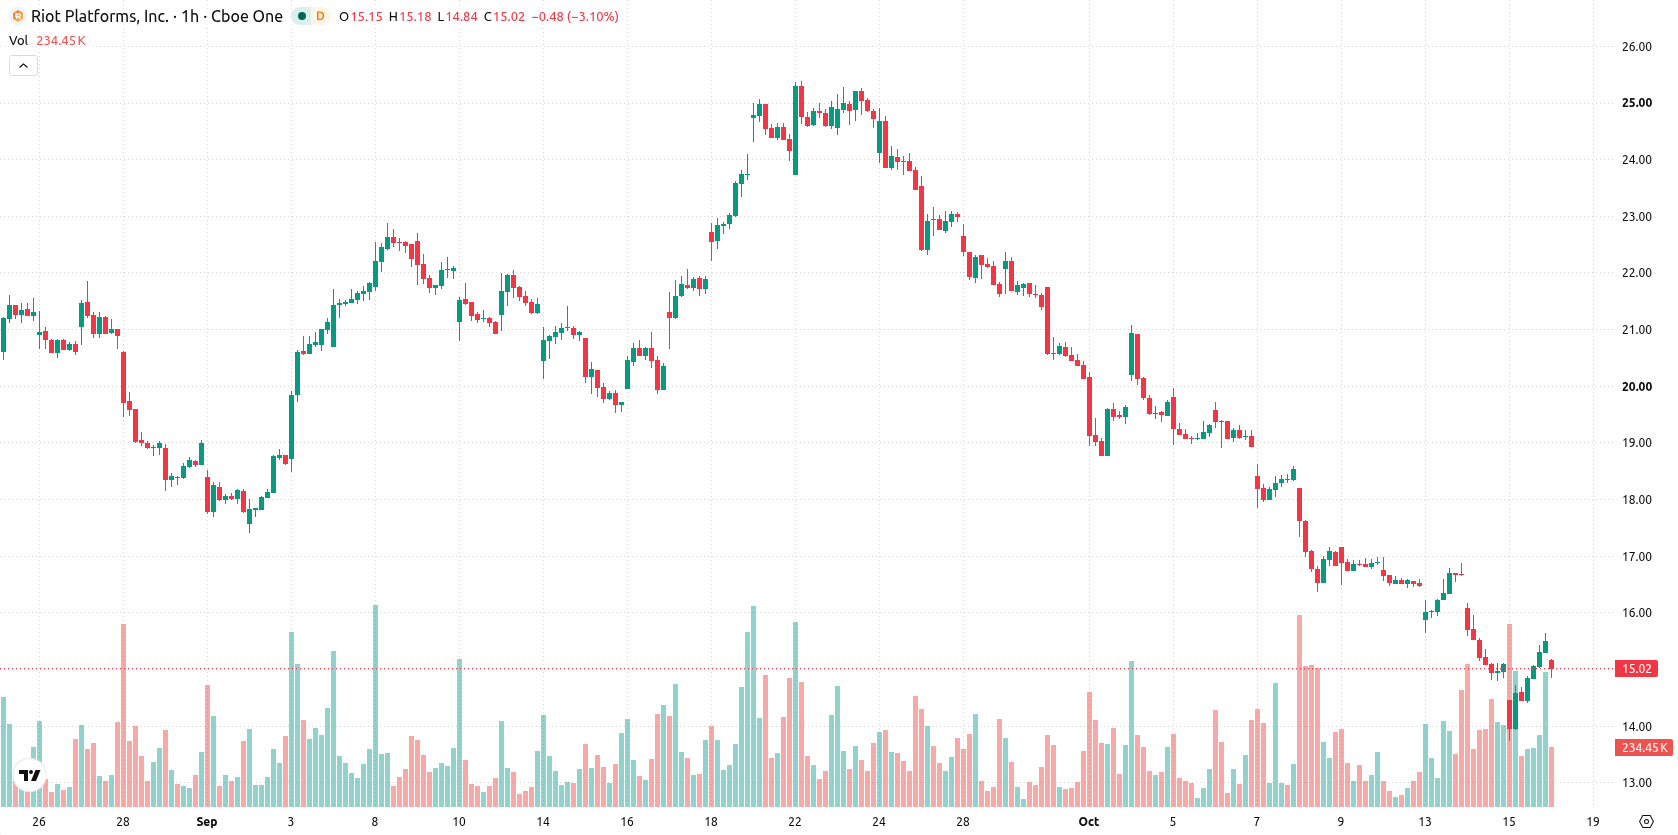
Riot Platforms (RIOT) stock is trading at $14.98, down 3.82% on the day. The price currently sits below its key moving averages, reflecting a session marked by heightened volatility and negative momentum.
 15.15
16.91
15.15
16.91
Highlights
- Riot Platforms stock declined after September inflation data exceeded expectations, raising concerns about further Federal Reserve interest rate hikes.
- Higher borrowing costs pose risks for technology infrastructure companies like Riot Platforms, pressuring expansion plans and operating margins.
- RIOT/USD trades below key moving averages with strong selling momentum, a projected range of $13.56 to $16.76, and a 74% probability of further downside.
Inflation surprise raises rate hike risk for capital-intensive tech
Riot Platforms stock faced pressure following the release of September inflation data that came in above expectations, increasing the likelihood of further interest rate hikes by the Federal Reserve, according to Investing.com. The prospect of higher borrowing costs raised concerns for capital-intensive technology infrastructure companies such as Riot Platforms. Elevated financing expenses can dampen expansion plans and weigh on operating margins within the sector, contributing to the ongoing selling pressure.
Divergent signals as resistance holds and sell momentum intensifies
On the hourly chart, RIOT is trading below the MA-20 at $15.44, the MA-50 at $16.49, and the longer-term MA-200 at $19.49. The Kijun level from the Ichimoku indicator at $15.3 now serves as immediate resistance. MACD currently shows a Strong Sell signal, with ADX confirming a Sell stance. RSI stands at 47.6, reinforcing a Sell bias. However, Stochastic RSI points to an overbought condition and CCI is neutral, creating a divergence among oscillators. Bull/Bear Power remains in Buy territory, suggesting the presence of some intraday buyers, while the Awesome Oscillator is neutral despite prevailing negative momentum.
Downside favored as probability points to continued range-bound trade
In the short term, RIOT is expected to trade within a range between $13.56 and $16.76, reflecting typical volatility for the stock. There is a 26% probability of an upward price move, but the dominant scenario is a continuation to the downside, with a 74% likelihood. Sideways consolidation within this defined range is the baseline expectation. A bullish reversal would require a breakout above immediate resistance at $15.3, while further downside could be triggered by a decisive break below $13.56.
Earlier, analysts noted that Riot Platforms was experiencing sustained technical weakness and a dominant bearish outlook. The current article confirms and strengthens this view, as recent inflation data and ongoing negative momentum continue to pose downside risk, making attention to a potential break below $13.56 especially important for traders.









-
 Afghanistan
-
 Albania
-
 Algeria
-
 Angola
-
 Argentina
-
 Armenia
-
 Australia
-
 Austria
-
 Azerbaijan
-
 Bahamas
-
 Bahrain
-
 Bangladesh
-
 Belarus
-
 Belgium
-
 Bolivia
-
 Botswana
-
 Brazil
-
 Brunei
-
 Bulgaria
-
 Cambodia
-
 Cameroon
-
 Canada
-
 Chile
Chile
-
 China
China
-
 Colombia
-
 Congo
Congo
-
 Costa Rica
-
 Cote d'Ivoire
-
 Croatia
-
 Cuba
Cuba
-
 Cyprus
-
 Czechia
-
 DR Congo
-
 Denmark
-
 Dominican Republic
-
 Ecuador
-
 Egypt
Egypt
-
 El Salvador
-
 Estonia
-
 Eswatini
-
 Ethiopia
-
 Finland
-
 France
-
 Georgia
-
 Germany
-
 Ghana
Ghana
-
 Greece
-
 Haiti
Haiti
-
 Hong Kong
-
 Hungary
-
 India
India
-
 Indonesia
-
 Iran, Islamic republic
-
 Iraq
Iraq
-
 Ireland
-
 Israel
-
 Italy
Italy
-
 Jamaica
-
 Japan
Japan
-
 Jordan
-
 Kazakhstan
-
 Kenya
Kenya
-
 Korea
Korea
-
 Kuwait
-
 Kyrgyzstan
-
 Laos
Laos
-
 Latvia
-
 Lebanon
-
 Lesotho
-
 Libya
Libya
-
 Lithuania
-
 Luxembourg
-
 Madagascar
-
 Malaysia
-
 Malta
Malta
-
 Mauritius
-
 Mexico
-
 Moldova
-
 Mongolia
-
 Montenegro
-
 Morocco
-
 Mozambique
-
 Myanmar
-
 Namibia
-
 Nepal
Nepal
-
 Netherlands
-
 New Zealand
-
 Nigeria
-
 North Macedonia
-
 Norway
-
 Oman
Oman
-
 Pakistan
-
 Palestine
-
 Panama
-
 Papua New Guinea
-
 Paraguay
-
 Peru
Peru
-
 Philippines
-
 Poland
-
 Portugal
-
 Puerto Rico
-
 Qatar
Qatar
-
 Reunion
-
 Romania
-
 Rwanda
-
 Saudi Arabia
-
 Serbia
-
 Singapore
-
 Slovakia
-
 Slovenia
-
 Somalia
-
 South Africa
-
 Spain
Spain
-
 Sri Lanka
-
 Sweden
-
 Switzerland
-
 Syria
Syria
-
 Taiwan
-
 Tajikistan
-
 Tanzania
-
 Thailand
-
 Trinidad and Tobago
-
 Tunisia
-
 Turkey
-
 UAE
UAE
-
 Uganda
-
 Ukraine
-
 United Kingdom
-
United States
-
 Uruguay
-
 Uzbekistan
-
 Venezuela
-
 Vietnam
-
 Yemen
Yemen
-
 Zambia
-
 Zimbabwe
- Forex
- Crypto












